“The issue of being right or wrong is not important. What is important is whether the potential reward is fair compensation for the risk you are willing to accept.”
= = =
Editors’ note: This article expands on a previously published TraderPlanet article by this same author. Click here to read his first story: Look Before You Leap Technicals For Investors.
= = =
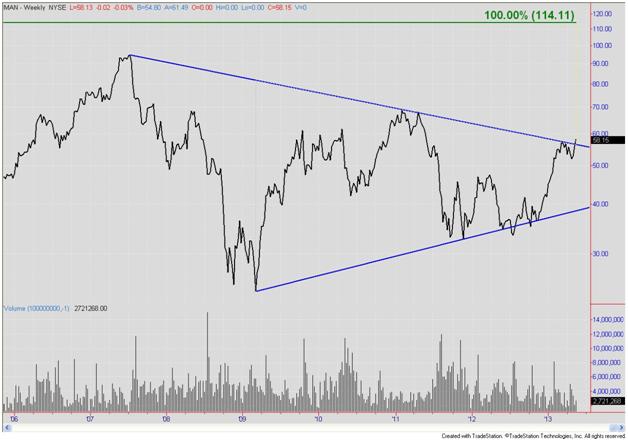
See Figure 1 for an upside breakout from a Symmetrical Triangle. Standard measuring techniques generate a projection of about 114. Does that mean buy ManpowerGroup?
Not necessarily.
WHAT WILL YOU RISK?
What risk are you willing to accept for that potential reward? Based on the Novemsky and Kahneman study [Nathan Novemsky and Daniel Kahneman, “The Boundaries of Loss Aversion”, Journal of Marketing Research, Vol 42 ( May 2005), 119 – 128], you should seek at least twice the reward for the amount of risk. A relatively common Risk : Reward ratio on Wall Street is 1:2, coincidence?
So, for an upside target of 114, where can you buy?
STEPS TO FOLLOW
This is my process for evaluating a potential trade idea:
1. Is the breakout confirmed? I use a threshold of 2% (3% or higher for low priced stocks).
2. Generate target.
3. Determine stop.
4. Calculate Risk : Reward.
a. Is it better than 1:2? Then enter trade.
b. Is it worse than 1:2?
i. Is there a viable entry that provides a better than 1:2 ratio? Place limit order.
ii. If there is not a viable limit, move on.
Step 1 is complete.
THE STOP POINT
Now on to step two – the stop.
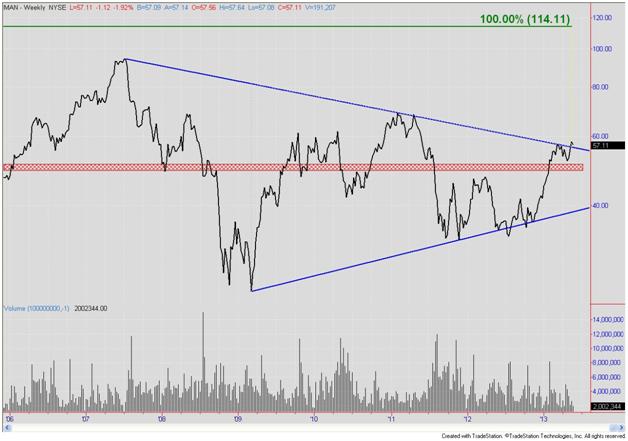
The red price zone is between 49 and 51. The April 2013, June 2011, February 2010, and October 2009 lows held above the top of the zone. The added cushion down to 49 attempts to avoid getting “shaken out” of the long.
Therefore:
Entry ≈ $57.00, Stop < $49.00, Target ≈ $114.00 yields a Risk : Reward ratio of 1:7. That works out to a very aggressive expectation. Using Fibonacci extensions, we arrive at a more conservative target of $90.80 and a Risk : Reward ratio of 1:4. That is still an aggressive target, but one that MAN is more likely to reach.
What is the importance of evaluating the Risk : Reward ratio? At 1:2, you need to be correct 33% of the time to break even. 1:3 lowers the threshold to 25%. However, as the ratio continues to get smaller, the probability of reaching the target diminishes. You must take that into consideration when selecting a subset from the trade ideas that meet your criteria.
SPX BREAKOUT?
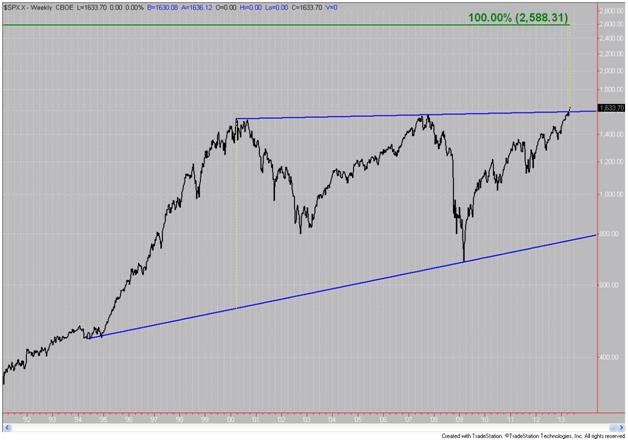
On May 10th, the S&P 500 confirmed a breakout above the top of an Ascending Triangle on the Weekly chart. The breakout projects to ≈ 2590. Let’s repeat the process to see if it makes sense to buy into the breakout.
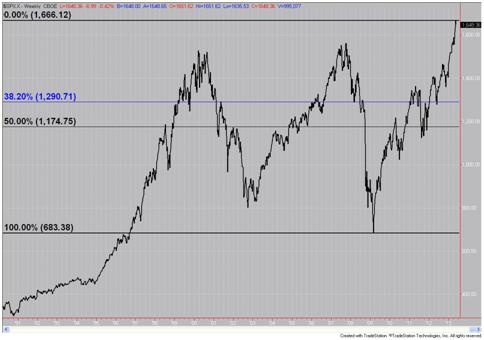
Scenario 1:
Entry ≈ 1650, Stop < 1275, Target ≈ 2580. Here we add a little wiggle room from the 38.2% Fibonacci retracement (≈ 1291) of the rally from the 2009 lowest close to the May 17th highest close. It will also be below the 200-week moving average, which is currently ≈ 1270, and rising ≈ 3 points per week. Scenario 1 yields a Risk : Reward ratio of 1:2.5.
Scenario 2:
Entry ≈ 1620, Stop < 1150, Target ≈ 2580. Here we add a little wiggle room from the 50% Fibonacci retracement (≈ 1175) of the rally. Scenario 2 yields a Risk : Reward ratio of 1:2.
Depending on your expectation of the severity of a pullback, there are different opportunities to trade the breakout.
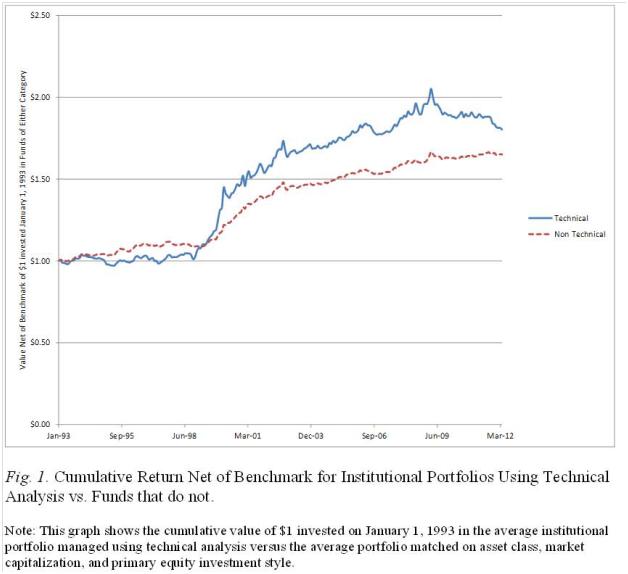
We’ll leave you with a chart from an academic paper that suggests technical analysis can enhance a portfolio manager’s performance.
REFERENCE:
David M Smith, Christophe Faugere, Ying Wang, “Head and Shoulders Above the Rest? The Performance of Institutional Portfolio Managers Who Use Technical Analysis”, Department of Finance and Center for Institutional Investment Management, School of Business, University at Albany (SUNY), (January 2013)