

I’m not the biggest fan of technical indicators. I feel indicators are always lagging and there is no such thing as a “leading indicator.” However, I felt if I did write about one of my favorite technical indicators, some may appreciate the insight.
The Average Directional Index (romantically at times referred to as ADX) was created by J. Wells Wilder. He created many other indicators as well. ADX is designed to measure the strength of a trend. ADX is truly an average of Wilder’s Directional Movement Indicator (DMI). Below is a visual example of the DMI indicator, two lines which move in opposite directions. Its semi confusing and not super beneficial.
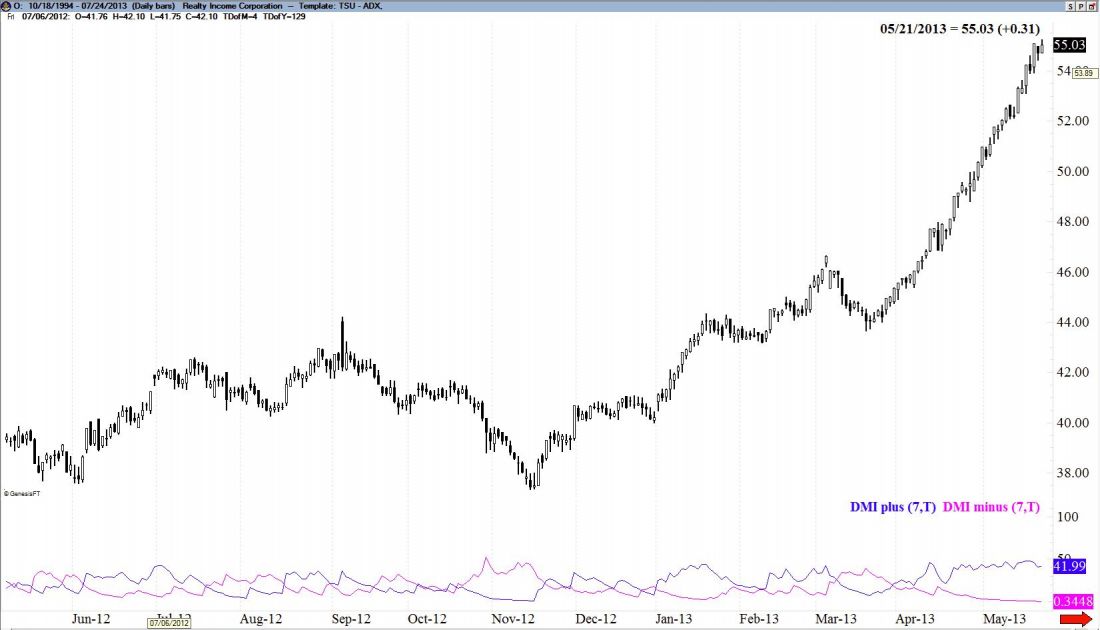
However, ADX is a blend of the DMI positive and negative. ADX is not a momentum indicator, it simply moves up with a strong trend, either a bullish or bearish trend. The ADX line will move down with a weak trend or a sideways move. Traders can set parameters for their ADX. When it is around or below 20, there is not trend, meaning a trend is ready to emerge.
As traders we must look at the highs of ADX on a case by case basis. 45-50 begins the high range but it can go much higher. However, the higher an ADX reading, the sooner the trend will begin to weaken (either reverse or begin to move sideways).
ADX helped me make one of the best “bubble bursting calls” of my career, to date. Ticker symbol O showed an ADX reading of 92.93, which is simply unheard of. I still have yet to find another ADX reading higher. The trend looked quite parabolic and unsustainable. This is when the news on Real Estate Investments Trusts was the most positive and bullish. A few students asked my perspective on ticker O.
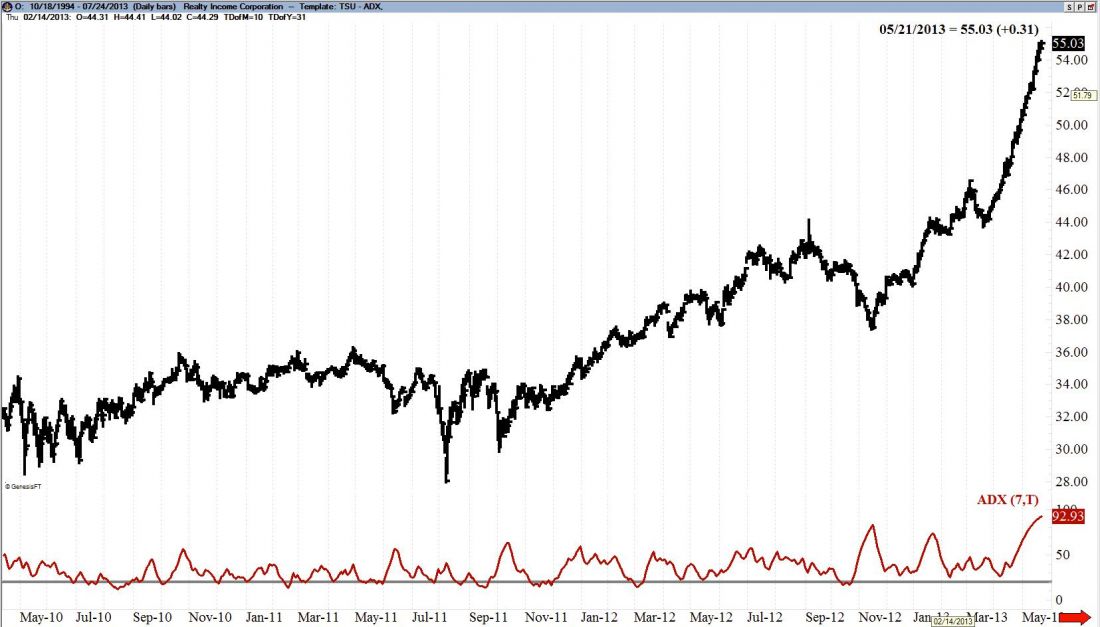
I simply said, “O is obviously very bullish. However, the angle is unsustainable and when it does fall, it will fall hard and fast.”ADX was the real qualifier for this, because of its unmatched highs and steep angle. Over the next 3 weeks, O fell by 15 points, which allowed ADX to ‘reset’ meaning, come back to the 20 reading, which is “healthy” for a stock and its ADX reading.
In conclusion, ADX is a great indicator that I personally use quite often, to determine if a stock trend has to rest, or is about to begin anew. My setting for ADX is 7 days. I hope this tool allows you as a trader to continue to improve and progress.

