

Its friendless shares had meandered around the $25 level for the past six months, basically having been left for dead. But, then, Facebook (FB) suddenly spiked 30% on July 25, 2013, and closed at $34.36. On August 5, it reached an intraday high of $39.32, surpassing its IPO price of $38. This resurrection surprised a number of traders and market analysts. Was there any way to have anticipated this move? Yes, by using technical analysis.
BASICS OF ELLIOTT WAVE
Let’s examine how using Elliott wave analysis could have helped us to go long Facebook at the most opportune time. First, a look at the characteristics of the Elliott wave pattern.
The basic Elliott wave pattern comprises a series of five distinct price movements or “waves” that are linked together. They achieve progress over a specific time period as market prices move up or down. This five-wave sequence is called the motive phase or motive wave, because it propels the market in the direction of the main trend within a particular time frame. In the motive phase, the waves are numbered 1 through 5. The most common type of motive wave is the impulse wave.
THREE WAVE CORRECTION
After a five-wave sequence is complete, the corrective phase or corrective wave begins. It is composed of three waves or some variation thereof. The corrective phase partially retraces the progress made by the motive phase, and its waves are labeled using letters, beginning with the letters A, B and C. The price lengths of certain waves within the same pattern are commonly related to each other by Fibonacci relationships such as the Golden Ratio of .618 or equality, which will come into play when we look at Facebook’s chart.
SPOT TURNING POINTS
Applying Elliott wave analysis generally involves three key ways to spot major market turning points:
1. Identify the completion of a particular wave pattern at a given timeframe.
2. Find more than one Fibonacci price relationship (called a Fibonacci cluster) that coincides with the termination price point of that same pattern.
3. Wait for the break of a key trendline that sets a boundary for the respective pattern.
Any one of these conditions provides evidence of an imminent trend change. If all three exist, then the evidence is much stronger. Guess what? In June and July 2013, all three conditions were present in Facebook.
ANATOMY OF FACEBOOK CHART
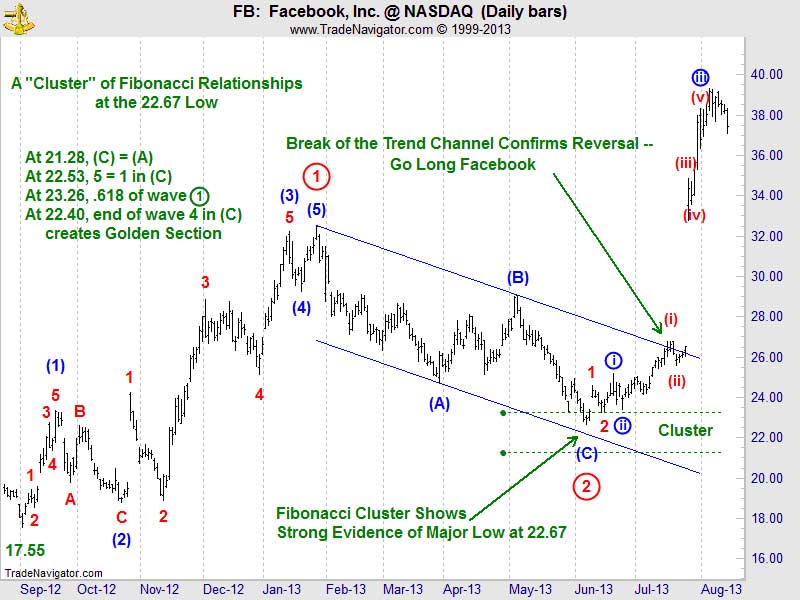
In Figure 1, starting from the September 4, 2012, low at $17.55, Facebook stock’s price traced out a clear and complete Elliott wave pattern. We see an impulse wave in the form of a five-wave advance, numbered (1) through (5), which completed Primary wave 1 (circle) on January 28, 2013, at $32.51. The impulse wave was followed by a three-wave corrective pattern labeled (A)-(B)-(C), which completed Primary wave 2 (circle) on June 6, 2013. This kind of corrective structure is called a zigzag. After the zigzag ended, there was a major rally that went well beyond the high of wave 1 (circle).
The termination point of the wave 2 (circle) zigzag at $22.67 was a major turning point. At that point, Facebook added another friend: Fibonacci price relationships. FB’s turning point corresponds to four key Fibonacci relationships:
1. The most common relationship for the price length of wave C in a zigzag is that wave C equals wave A. Wave (C) equals wave (A) at $21.28.
2. A second wave will often retrace .618 of the first wave. At $23.26, wave 2 (circle) retraces .618 of wave 1 (circle).
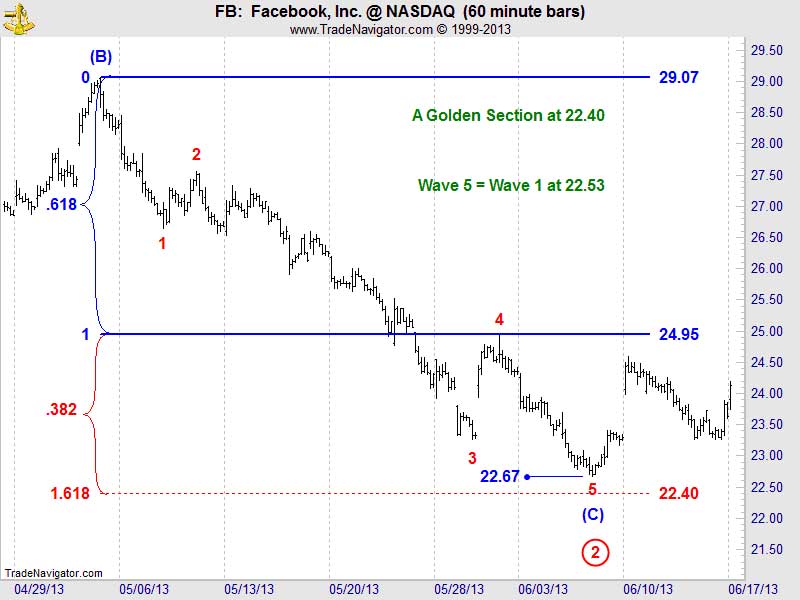
3. In an impulse wave, if the third wave is elongated or extended, it’s common for the fifth wave to equal the first wave. In Figure 2, when we zoom in on wave (C) of wave 2 (circle), we see an impulse wave with an extended third wave. Also, at $22.53, wave 5 equals wave 1.
4. In an impulse wave, the end of wave four will often divide the entire impulse wave into the Golden Section, i.e. .618 and .382. In Figure 2, if the impulse wave ends at $22.40, the end of wave 4 divides the entire impulse wave into the Golden Section.
Impulse waves, zigzags and multiple zigzag patterns often travel within a parallel trend channel. Parallel upper and lower price trendlines mark the boundaries of the channel. In the case of a declining zigzag correction, if it breaks the upper trendline of the channel, such a move provides strong evidence that the trend to the upside has resumed. In Figure 1, Facebook broke the upper trendline of the zigzag’s trend channel on July 16, 2013. Seven trading days later, Facebook rose 30%.
WHAT’S AHEAD?
Where does Facebook go from here, before making another correction? Wave 3 (circle) could possibly travel to $46.88, which represents the length of wave 1 (circle) times a Fibonacci 1.618.
= = =
Realated Reading:
Getting Started With Elliott Wave Theory
The Three Major Rules Of Elliott Wave Principle

