

We live in interesting times. That’s not a good thing.
Things are starting to get interesting in the S&P 500 futures market. That’s not a good sign.
- We are still in the summer doldrums this week, and most senior traders are safely tucked away at a beach, far from the maddening turmoil of the markets – which means less experienced people have their hands on the steering wheel. Not all of them know how to drive safely.
- It is also a slow week for official economic data – and in the absence of real information, rumors will be floated on all sides to trap the unwary.
- There are two related events this week that generate rumor the way GE generates electricity: the release of the Federal Reserve Open Market Committee Wednesday and the annual meeting of the world’s central bankers in Jackson Hole Wyoming on Thursday,. The fact that Fed Chairman Ben Bernanke is skipping the meeting this year, for the first time in recent memory, only adds grist to the rumor mill. All in all, this is a good time to be skeptical.
- And we are moving into the fall of the year, when aging Bull markets like to lie down and die.
So while we are not calling the end of the bull yet, the short-term outlook is definitely to the downside.
DISTURBING TECHNICAL INDICATORS
There are the technical elements of the market, which are just as disturbing.
First, there have been a cluster of “Hindenburg Omens” in the New York market. This is a technical indicator that supposedly presages a turning point when the market will crash and burn – just like a German airship that blew up in 1937, which gives the indicator its name.
The important thing is that while the Hindenburg gives lots of false positives – there are lots of Omens that are not followed by major sell-offs – the reverse is not true. It is rare to see a major market sell-off that is not preceded by a Hindenburg Omen.
And there are lots of them – five in the last seven days – flashing a warning right now.
Finally, there is the thing we count on constantly, the charts. And the charts are not encouraging for the bulls.
S&P E-MINI FUTURES (ESU3) DAILY CHART
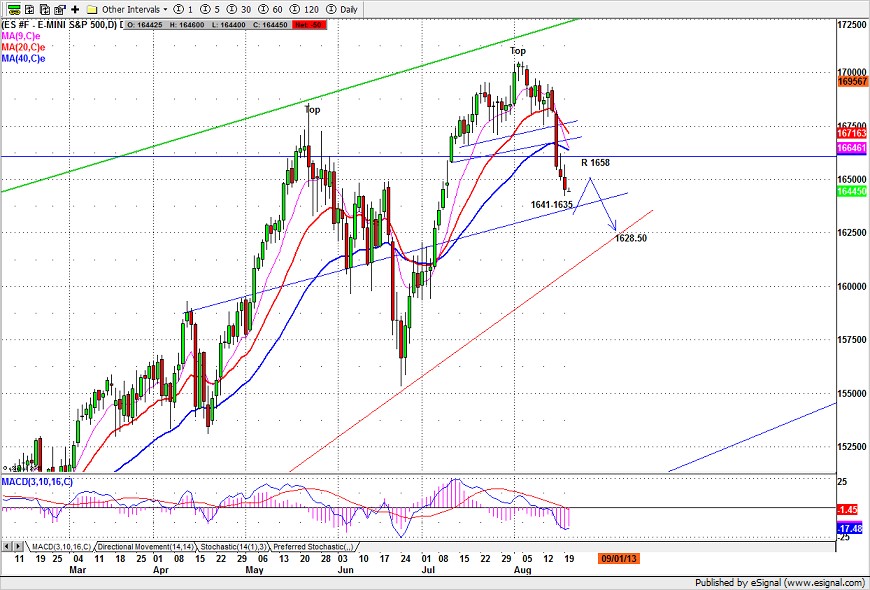
The ES (S&P500 e-mini futures contract) seems to be forming a skewed double top pattern, which is bearish. While we previously thought 1728 could be the top for this move up, that target now seems unlikely, and the high at 1705 made on August 2 looks like the end of the current up move.
SHORT-TERM OUTLOOK
The succession of red bars speaks for itself: the ES broke through a support zone this week, and the bulls lost the pivot support at 1648.50. Unless they can regain that level and move the price back above 1656-58, we think another leg down is in the cards. The next major support is 1620-25.
There is a reasonable chance of a bounce from the current level, if ES can stay above Monday’s low (1642.25). The bounce could carry up to 1675-80.
But no matter which way the market moves for the rest of this week, the nearby trend is down, and likely to stay down for some time. We’re trading this one from the short side, and a bounce, if there is one, will be regarded as a better opportunity to get in.

