

I’ve written before about my favorite indicator: the average directional index (ADX). Today, I would like to discuss another indicator. I don’t “see” it as an indicator specifically, because it’s so beautifully tied to price and does not lag. If I had to rank its importance among other chart signals and “indicators” it would rank second, under only candlesticks.
I am referring to volume. The volume of a stock can show so much insight into the sentiment of the buyers and sellers. It truly can be a microscope into the future price movement of a stock. Volume should always confirm a trend. So, if a stock is going up or down, you want to confirm the trade with increasing volume. Simply put, think of volume, like gas in your car. The more gasoline in your tank the further you can go. I am going to cover a few important aspects of volume.
LOOK AT THE NUMBERS
The first is simply the amount of shares traded. This volume is important for liquidity. As a trader, you want to be in the same league as “the big boys.” That’s right. You want to trade the same stocks the banks, institutions, funds and other traders invest in.
Why? Very simple. I have two reasons for you, oh eager one. First, people are predictable. Using technical analysis, one can quickly and easily see where buying pressure and selling pressure are located, in terms of support and resistance. The more people that trade the stock, the more predictable it becomes.
LOOK FOR BIG VOLUME TRADED
So, secondly, I truly want a stock to have more than 1,000,000 shares traded on a daily basis. Every now and then, I’ll make an exception for stocks like PNRA, PCLN, AZO and CMG. But I rarely trade those four. Very rarely in fact and yes, it’s purely because of volume.
KEY CLUES
An incredible insight into future trading behavior is found in continuation volume. This type of volume spotting truly does take a little practice but I’ll make it easy for you. Look for big volume spikes and then look to the right of that volume bar for a decrease in volume. Usually, you will see a corresponding continuation pattern. I teach these as stair step patterns, flag patterns and pennant patterns. Their distinguishing factors are size, shape, and a massive decline in volume. Let’s analyze a chart and I’ll make some visual examples for you.
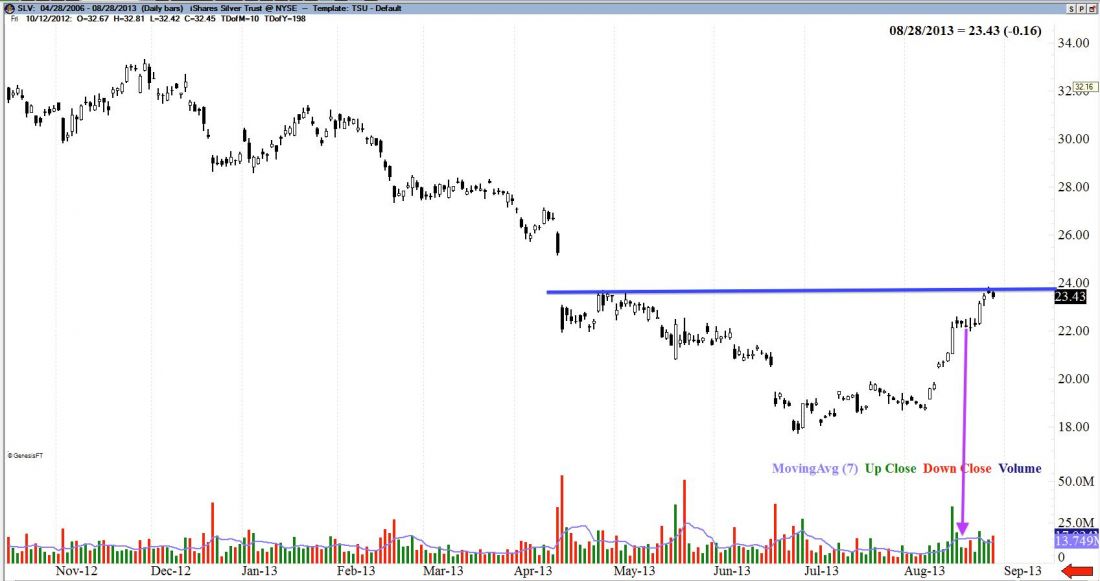
A SILVER TRADE
Take iShares Silver Trust ETF (SLV) for example. See Figure 1 below. This is a trade I place personally, so I will also walk you through my thought process. On July 3, the SLV chart shows a high wave spinning top candle. Which, along with it, is a very indecisive candle. But notice the volume spike. A lot of shares were traded that day. This is a pivotal candle. If the low gets broken, SLV is likely headed bearish. If the high is broken, the bulls should be taking over. On August 8 we get a gorgeous present. SLV actually gaps up and a long with it, comes a ton of volume. Over 11,000,000 shares were traded that day. That’s nothing to scoff at.
We combine the fact that on two days recently, we’ve had good volume spikes and poor volume in between those two days. In order to confirm a bullish trade, all we now need is SLV to close higher than 20.00 or the high of the July 22 candle. Well, on August 12, SLV does just that. With massive volume!
IT IS CONFIRMED
The trade is confirmed bullish. So, as you the volume increase that’s a confirmation of the trend. Then, volume really tampers off. Why? Two reasons. Original buyers begin to sell, taking their profit. The blue line represents the resistance from the previous large gap.
The purple arrow shows a nice solid decrease in volume along with five candles that move totally sideways. As volume decreases but the stock trades sideways, volume decreases. There is a balance of buyers and sellers and this is called “building pressure.” The most probable entry would be a bullish continuation. These continuation patterns usually last 2-8 days. Spotting that volume, I was able to make numerous references to SLV continuing its bullish thrust. And volume and candle sticks could have easily told the whole story.
With your support and resistance lines as a target, this trade is still ready to move. IF SLV closes above $23.94 after a few more days of sideways movement (and volume decline) it would show a continuation patter and a likely move to the next target of $26.00.
REMEMBER THIS
Volume should always confirm the trend. Make sure you keep a solid eye out for volume for any type of trade you want to enter. It should always confirm your trade and decrease during a sideways move.
= = =
[Ask your questions for Newsome below. Do you use volume? If so is there a specific volume indicator you like? We’d like to hear what works for you.]

