

When traders, especially swing traders, are looking for any trading opportunity in a market it is recommended to check the larger time frames first and see what the direction of a main trend is.
Today we will look at gold, where prices have been in a downtrend for almost two years now with accelerating downside price action seen since April when market finally took out the 1520 support.
If we look at monthly chart we can clearly see a bearish pattern that has room even for a drop to 1000-1100 dollars, or 1032 to be more precise which was high made in 2008 peak.
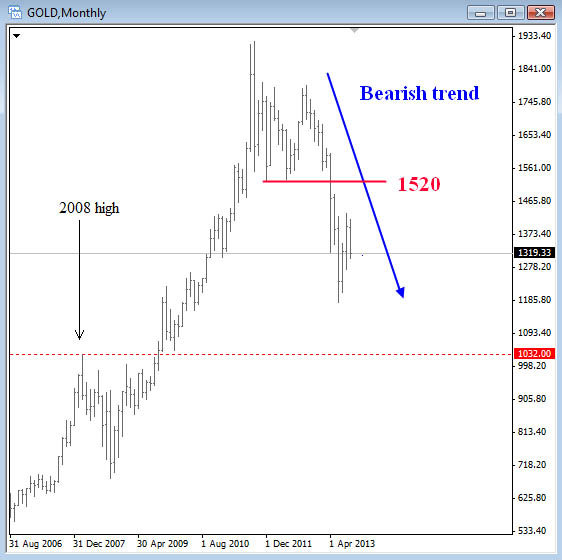
Gold monthly chart
So when larger trend is clearly evident on the charts we go down to smaller time frames, such case Daily and 4H and look for pull-backs that could be opportunity to join the larger downtrend. There are different tools and methods to analyze the markets, but I personally use the Elliott Wave Principle. The Elliott Wave Principle is a detailed description of how groups of people behave. It helps you to identify the market direction by knowing and understanding the structure of a price action.
One of the most common patterns is a three wave move, just a simple A-B-C structure called a zig-zag. This is a contra-trend structure, so when you can see this pattern on the charts within larger uptrend that it’s your advantage to understand in which direction markets will move. Below is illustrated the basic structure of a zig-zag with additional useful details
A zig-zag is a 3-wave structure labeled A-B-C, generally moving counter to the larger trend. It is one of the most common corrective Elliott patterns.
ZIGZAG BASIC STRUCTURE
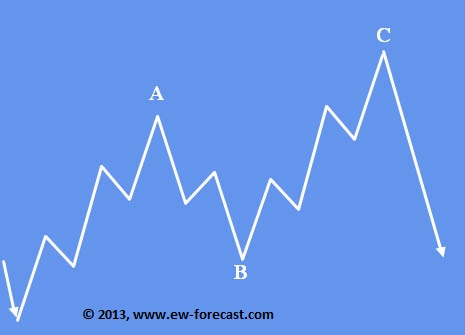
Figure 2 notes:
- Structure is 5-3-5
- Wave A must be a motive wave
- Wave B can only be a corrective pattern
- Wave B must be shorter than wave A by price distance
- Wave C must be a motive wave.
- Appears in wave two or four in an impulse, wave B in an A-B-C, wave X in a double or triple zig-zag, or wave Y in a triple threes
So if we go now back to gold and review the daily chart we can clearly see a three wave rally from the latest low up to 1433, labeled as A-B-C. More importantly, we can see a decisive break of the lower trend line of recent upward channel which is very important evidence for a completed rally and continuation of a larger trend, which is down based on monthly chart above. Therefore we think that zig-zag is complete which means that gold could revisit 1180 level in weeks ahead. With that said, we think that opportunities are within downtrend as long as 1433 high is not breached.
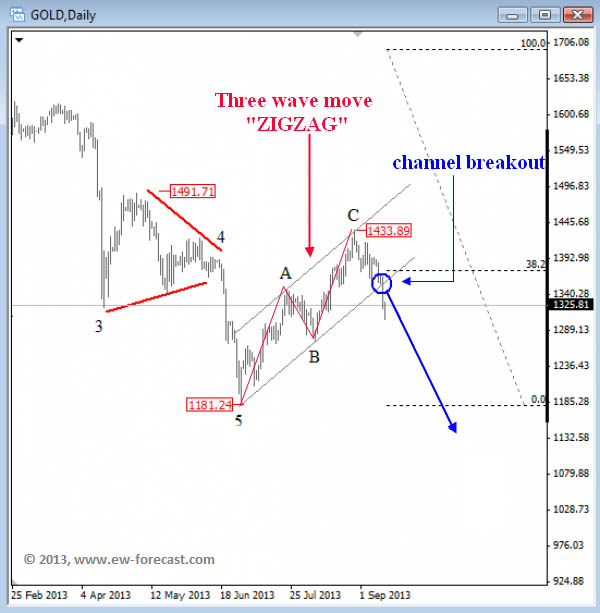
Gold daily chart

