

Traders are always looking for new ways to analyze the markets and extract useable data from charts and graphs. To gain an edge, traders may seek new ways to view historical or real-time data. Traders also want to stay connected to the markets, so they increasingly gravitate toward mobile-friendly tools that make market data and analytics accessible anytime and anywhere.
CQG Labs is a free, mobile-friendly website for traders and analysts interested in unique views of futures markets. CQG Labs provides unique market views, found nowhere else, that traders can use to transform the way they approach trading decisions. The theme: immediately useful at a glance views for traders.
MARKET BEHAVIOR AT A GLANCE
Consider the CQG Labs Market Statistics display (Figure 1). Instead of relying upon subjective intuitive experience as to whether crude oil is having a big day, traders see a glanceable statistical analysis view of market behavior. Here, four displays using histogram bars compare current crude oil market behavior to its history going back 350 sessions.
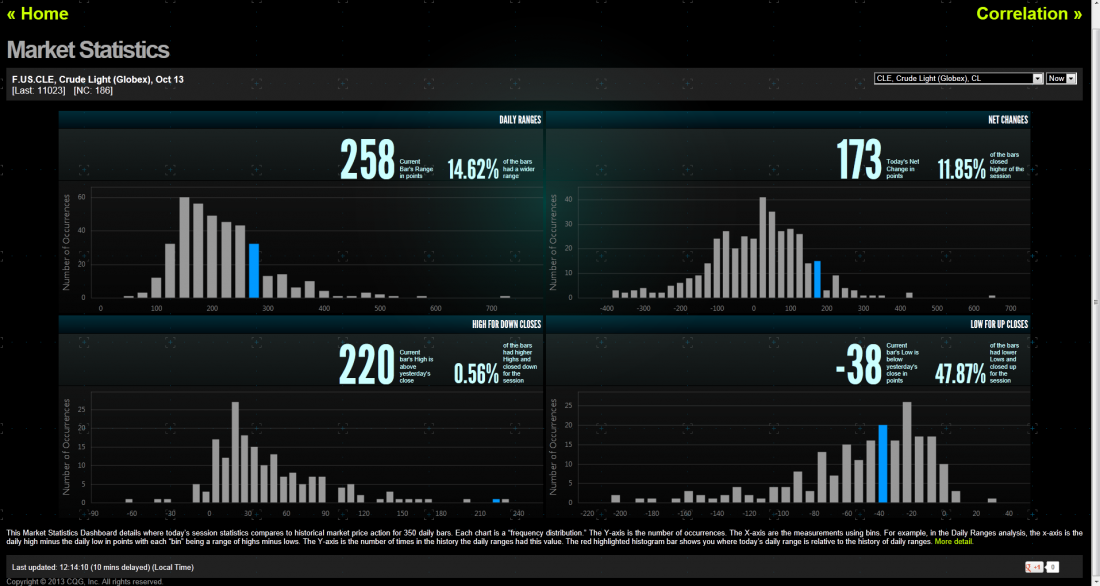
The first comparison, displayed as a frequency distribution, is today’s range and the number of times in the review period when the market had today’s range. Traders see a bell-shaped curve. The horizontal axis uses bins and the vertical axis is number of occurrences. Here, a bin is a price range. For example, crude oil bins are 25 cent increments. In Figure 1, 200 is a bin with a range of $1.76 to $2.00. The next bin is $2.01 to $2.25, then $2.26 to $2.50, etc. Histogram bar height for 200 is the number of times crude oil had a range that was $1.76 to $2.00. Blue highlighting represents where today’s range is relative to the history. The number of times on a percentage basis the market had a wider range is calculated for you.
Other analysis on the Market Statistics display includes today’s net change, today’s high minus yesterday’s close, and the number of times the market reversed and closed down. In Figure 1, on this particular day, the high was up $2.20 and only 0.56% of the time did this much upside momentum reverse for a close down. The same analysis is performed looking at downside momentum for an up close.
THE ROLL VISUALIZED
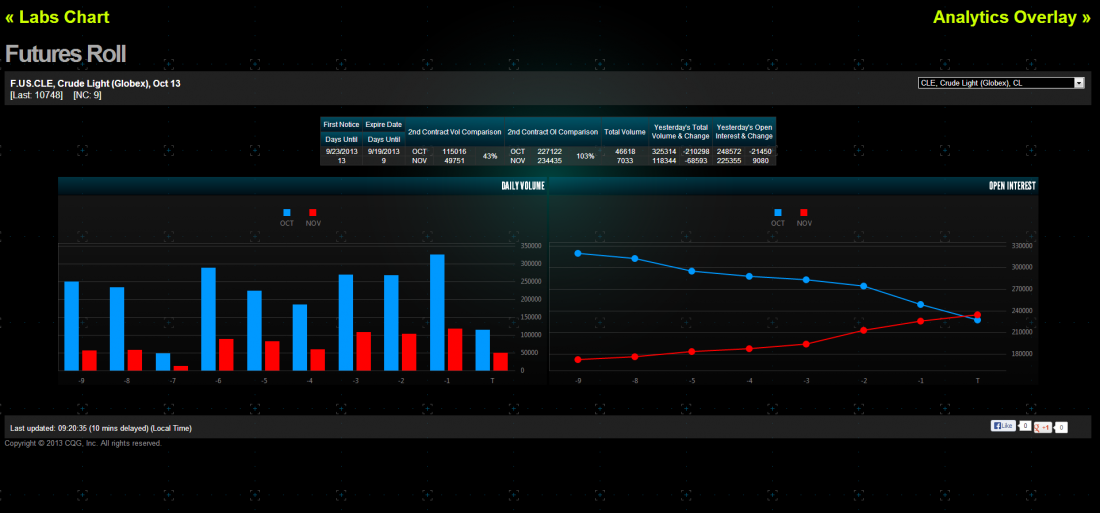
Traders need to track the roll, where traded volume and open interest for a contract nearing delivery or expiration shifts to the next contract. Traders can do just that with a unique display from CQG Labs. CQG Labs allows traders to view ten days of traded volume and open interest for two contracts. Figure 2 details the October and November crude oil contracts. Ten days of volume histogram bars shows that traded volume is still heaviest in October. However, traders can see by the declining open interest line for the October contract (blue line) and the rising open interest line for the November contract, which have crossed, that traders are rolling positions to the November contract.
MORE USEFUL VISUALIZATIONS
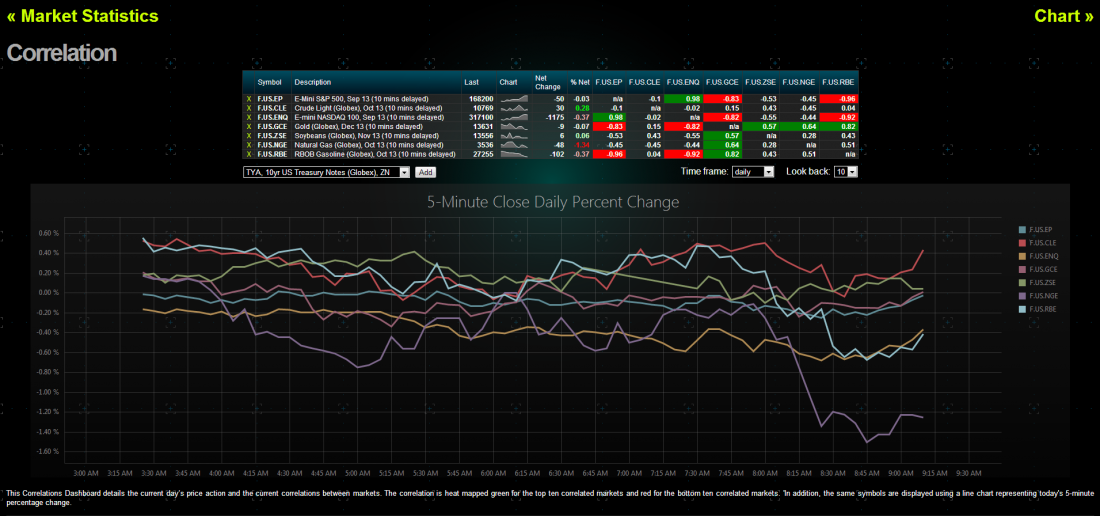
Another popular form of analysis is correlation. CQG Labs offers a view of correlation among markets using a heat-mapped display, as well as a five-minute line chart using percentage net change for today (Figure 3). Because the heat mapping indicates which markets are highly correlated and which markets are negatively correlated, traders can instantly spot markets at correlation extremes.
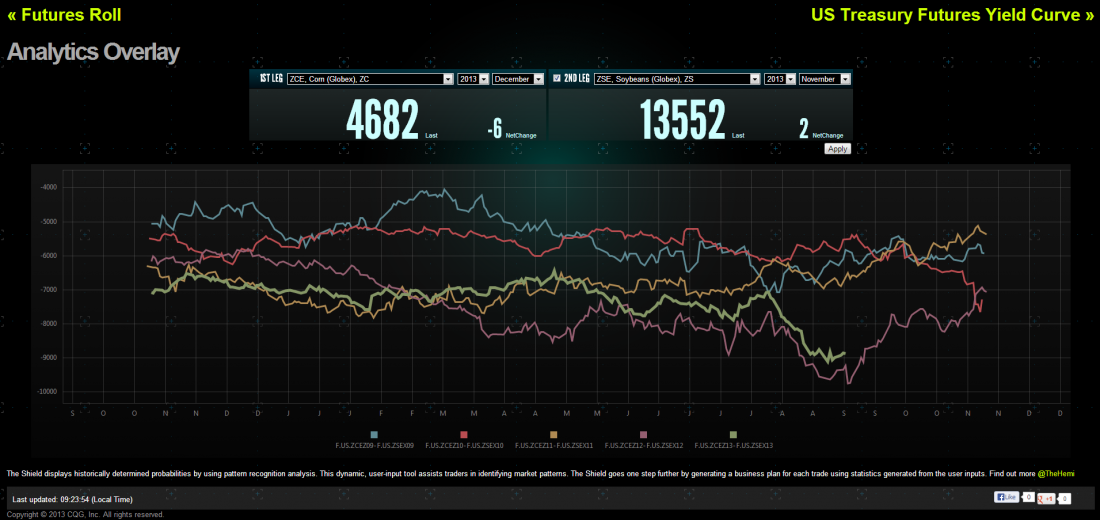
Another interesting view is called the Analytics Overlay (Figure 4), by CQG partner @TheHemi. This is a price spread comparison overlay to put market behavior in context year over year. Here traders can select two different futures contract symbols from the drop down list and see how the current spread prices are behaving relative to the last five years of spread price overlaid by year. Traders then have better context to make decisions on seasonal spreads.
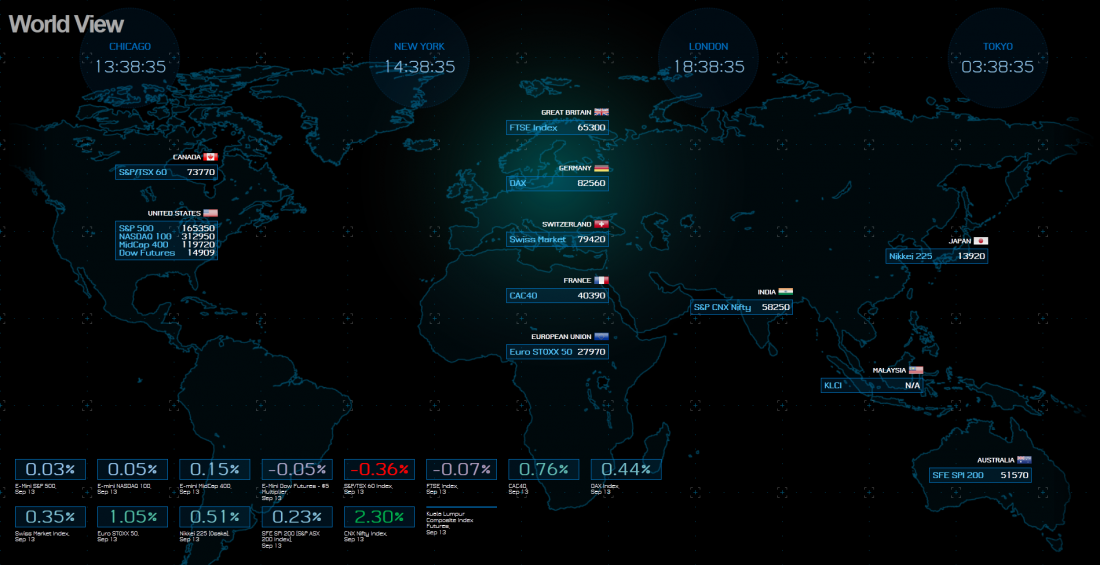
Finally, there is a World View display (Figure 5) that shows today’s stock index futures markets from around the world. At a glance, traders can know the relative performance of equity indexed futures around the world.
There’s no shortage of ideas that traders have come up with to analyze market behavior. Our focus in CQG Labs will be to continue to add more displays over time that are immediately useful, with little configuration necessary. Many of the new displays and tools will be driven from user ideas and feedback, ensuring that each innovation is impactful and available whenever and wherever a trader needs it.
#####
For more tinely trading ideas, check out TraderPlanet’s Markets on the Move ...

