

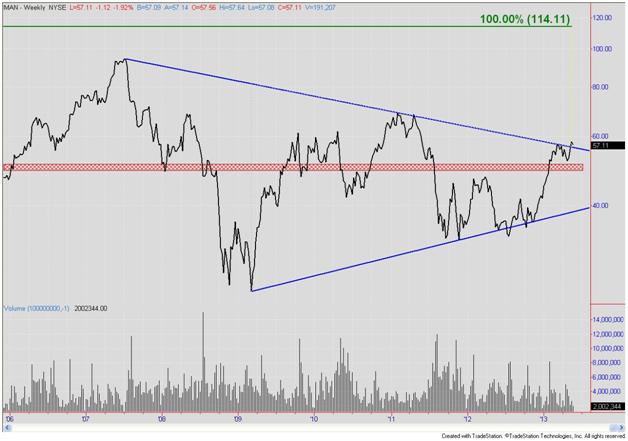
My previous TraderPlanet article proposed the following buy in ManpowerGroup Inc. (MAN), based on the breakout above the top of a Symmetrical Triangle formation:
Entry ≈ $57.00, Stop < $49.00, Target ≈ $90.80
THE TRADE BREAKDOWN
That generated a Risk:Reward ratio of 1:4. Here is the original chart. The red price zone is between 49 and 51. The April 2013, June 2011, February 2010, and October 2009 lows held above the top of the zone. The added cushion down to 49 attempts to avoid getting “shaken out” of the long.
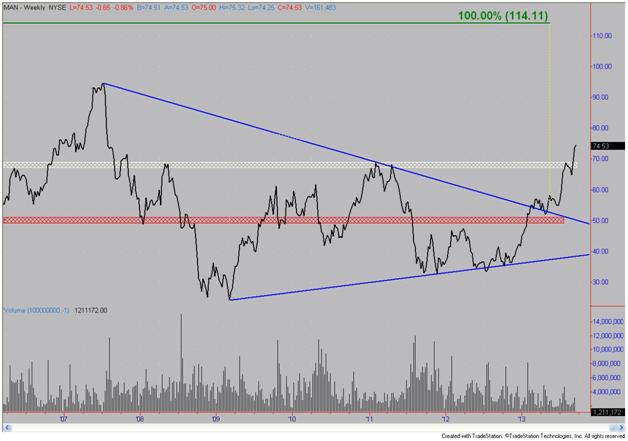
On the updated chart, you see MAN eclipsed $74.00, which is ≈ 22% below the $90.80 Target. The Stop < $49.00 is ≈ 34% below the current price, providing an unfavorable Risk : Reward ratio of 3:2. The white price zone is between 67 and 69. The May 2006, May 2008, February and April 2011, and August 2013 tops are inside the zone. Raising the stop to < $66.00 provides us with another “shake out” cushion and shifts the Risk:Reward ratio back to 1:2.
STOP LEVEL
To clarify – the Stop is based on the Weekly Close, not an intraday price.
THE BOTTOM LINE
It is within the realm of possibility that a Weekly Close below $66.00 takes MAN below the $57.00 Entry, but the probability is relatively low. Therefore, it is likely that a stop out of MAN would result in a profitable exit.

