

With new highs in the S&P 500 last week the bulls are excited again.
Never mind the fact that the Dow industrials index is still over 100 points below its 9/18/13 high. When determining the health of the broad market technicians like to “look beneath the hood” to the performance of individual sectors particularly the more cyclical groups.
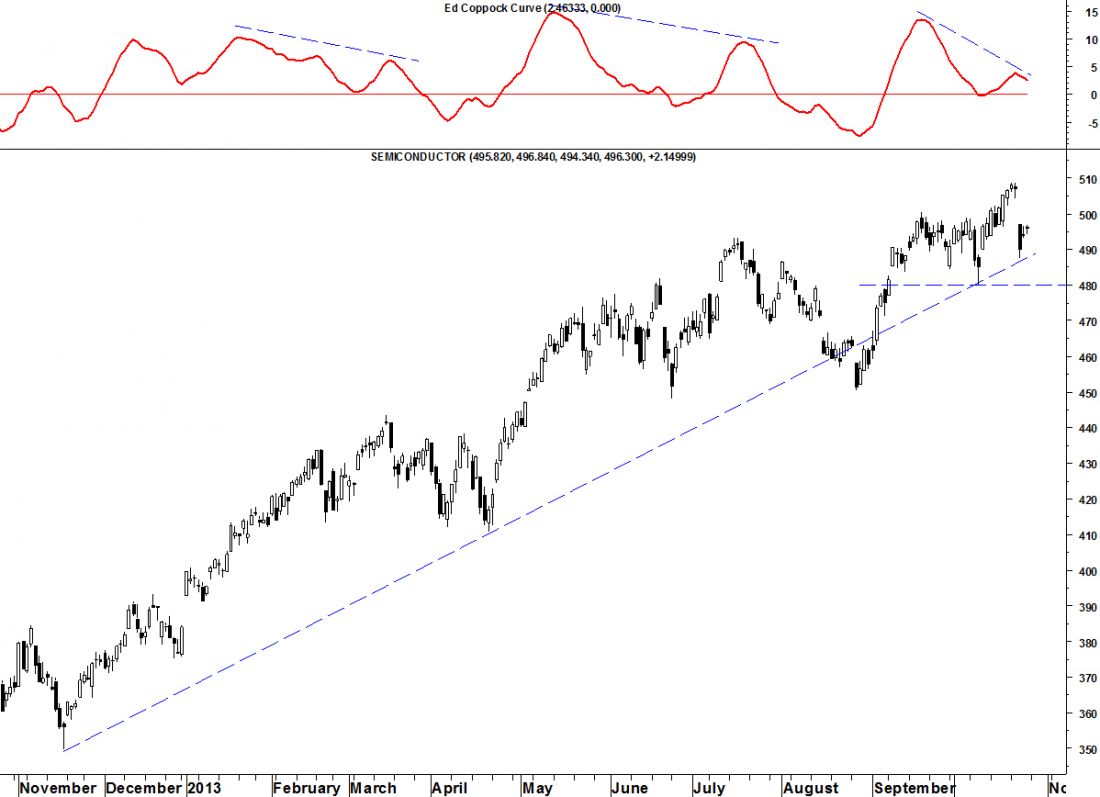
One of the most important leading sectors is semiconductors. As the S&P 500 – and even the tech-heavy NASDAQ Composite – were making new highs, semiconductors gapped down on Wednesday. While it held its November trendline, price action on Thursday and Friday has been contained within Wednesday’s candlestick giving no reason to expect a reversal. Note how Tuesday’s high (and previous highs) came with a negative divergence in the daily Coppock Curve. A break below 480 will confirm the top.
You don’t have to be a semiconductor investor to find the above observation to be of interest. With the exception of Consumer Staples, telecom, and utilities, every one of the ten GIC sectors indexes is seeing negative divergences in their Coppock Curves in both the daily AND weekly charts. Of course telecom and utilities are nowhere near their old highs. The negative divergences seen in the Coppock Curves of all the leading sectors is a bearish omen for the broad equity market.
= = =
Take a “sneak-peek” at Seattle Technical Advisors and get a 30% discount on a trial subscription for this week only, when you say you received this offer through TraderPlanet.
Read a feature story on Market Guru: George Lindsay by Ed Carlson here.

