

FB AND TSLA TAKING A TUMBLE
Tesla Motors (TSLA) broke out with a vengeance this March above its previous 2011 high at $36 per share. In a matter of a few months, the futuristic car maker gained more than 500%. TSLA has become the trader’s darling. Since finding resistance earlier this month, TSLA is now 30% below its peak.
Another favorite is Facebook Inc. (FB), which like TSLA, has seen impressive gains in a matter of a few months, fueling excitement for FB and its group. However, Twitter’s IPO last week did not discourage profit taking for either FB or LinkedIn Corp. (LNKD). Today, FB is dancing around its 10/50 day moving average, and LNKD is below it. No doubt there are many who will be trying to gauge when these movers have found a bottom in hopes that they will resume their meteoric rise. The bulls and the bears may debate whether TSLA or FB has more room to grow, but the better question may be how long these high flyers will trade sideways before they establish a new trend.
LESSON FROM AAPL AND PREVIOUS HIGH FLYERS
Time and again, high flyers come and go. Google Inc. (GOOG), the internet giant, did not recapture its 2007 high until earlier this year. More recently the favorite has been AAPL, although it has been more than a year since Apple Inc. (AAPL) crossed the $700 level, and almost a year since AAPL fell below its 10/50 week moving average. While AAPL may have been an exciting stock for shorter term traders during this time, like other stocks that have risen sharply and subsequently fallen, it has not performed well for longer term investors.
LOOKING FOR A NEW BUS TO CATCH
PerfCharts are a favorite tool for traders and investors to gauge the industry in which the next winners may be found. Figure 1 is the PerfCharts for the S&P Sector ETF’s since the summer of 2012, the peak of the European financial crises and when the long-term bond market peaked, which signaled the Great Rotation from bonds to equities. A quick study demonstrates that the last year and half financials and cyclicals along with health care have dominated the S&P500. Cyclicals and Financials are often early leaders in a bull market. TSLA like Ford (F) in 2009 has benefited from this rather predictable business cycle rotation. Looking at Figure 1, we can see that industrials, materials and energy are also coming alive.
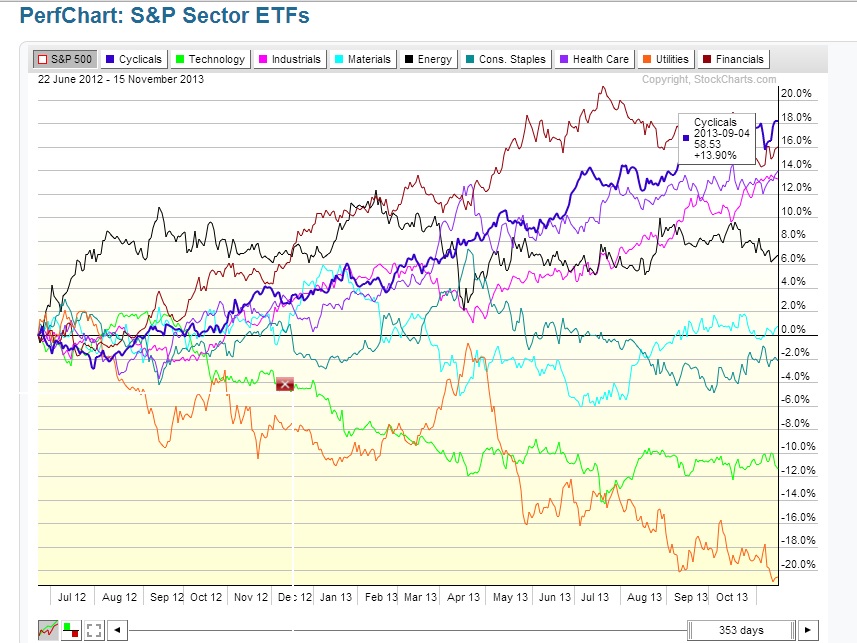
Figure 1, PerfChart: S&P Sector ETFs (June 2012 – November 2013)
ENERGY
Materials and industrials are gaining momentum and we are alerted that it may be time once again to look at energy. As shown in Figure 2, energy begins to gain momentum after materials and industrials enter the rotation.
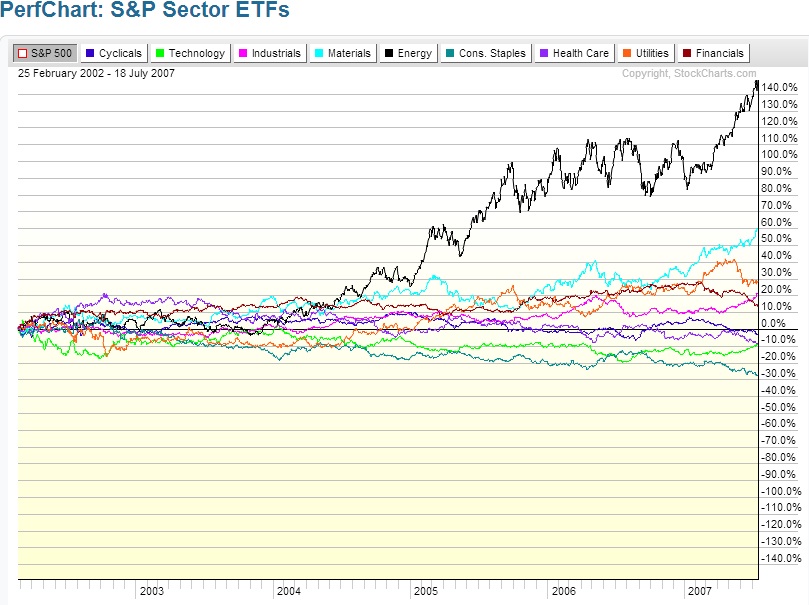
Figure 2, PerfChart: S&P Sector ETFs (2002 – 2007)
EXXON AND CHEVRON
Exxon Mobil Corp (XOM) and Chevron Corp (CVX) are hardly sexy names, but they are staples that see their demand rise time and time again. From a sector rotation perspective, we can expect to see XOM and CVX begin an attempt to trend. In fact, today, CVX is just trading above its 10/50 week mva and the XOM chart below is flirting with a breakout. Although, last week’s volume is yet to show confidence. It is not too early to begin watching XOM for confirmation. Both XOM and CVX have not progressed far beyond their 2011 peak.
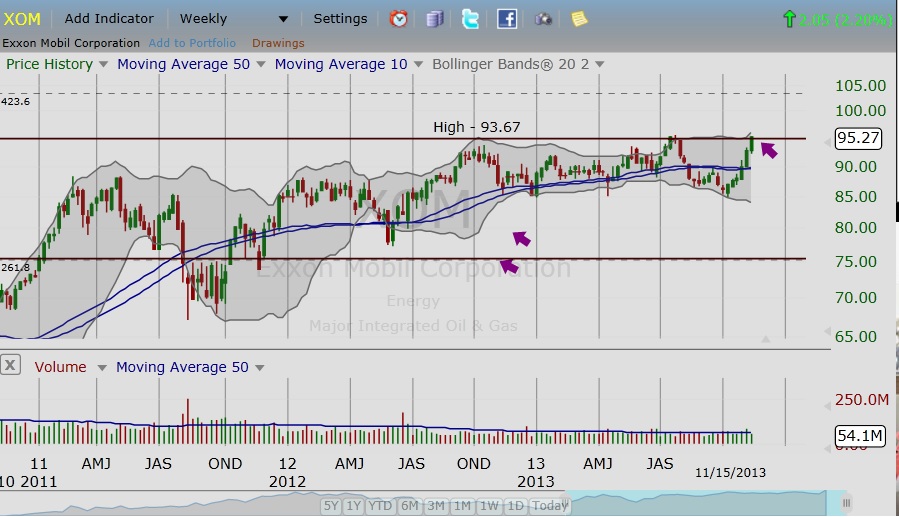
Figure 3, XOM weekly chart
TAKEAWAY
It can be difficult to pull ourselves away from old winners. However, as we have seen repeatedly, old winners can trade sideways for an indefinite period. These may be exciting vehicles for short term traders, but will yield little for longer term investors who do not have the time or flexibility to react to the market daily. Understanding sector rotation and business cycles can help longer term investors gauge where the market may be heading and where to begin looking for the next winners.
Reference:
Stock charts from FreeStockCharts.com
PerfCharts from StockCharts.com
No position in any names mention.
RELATED READING
Read another story by this author here:

