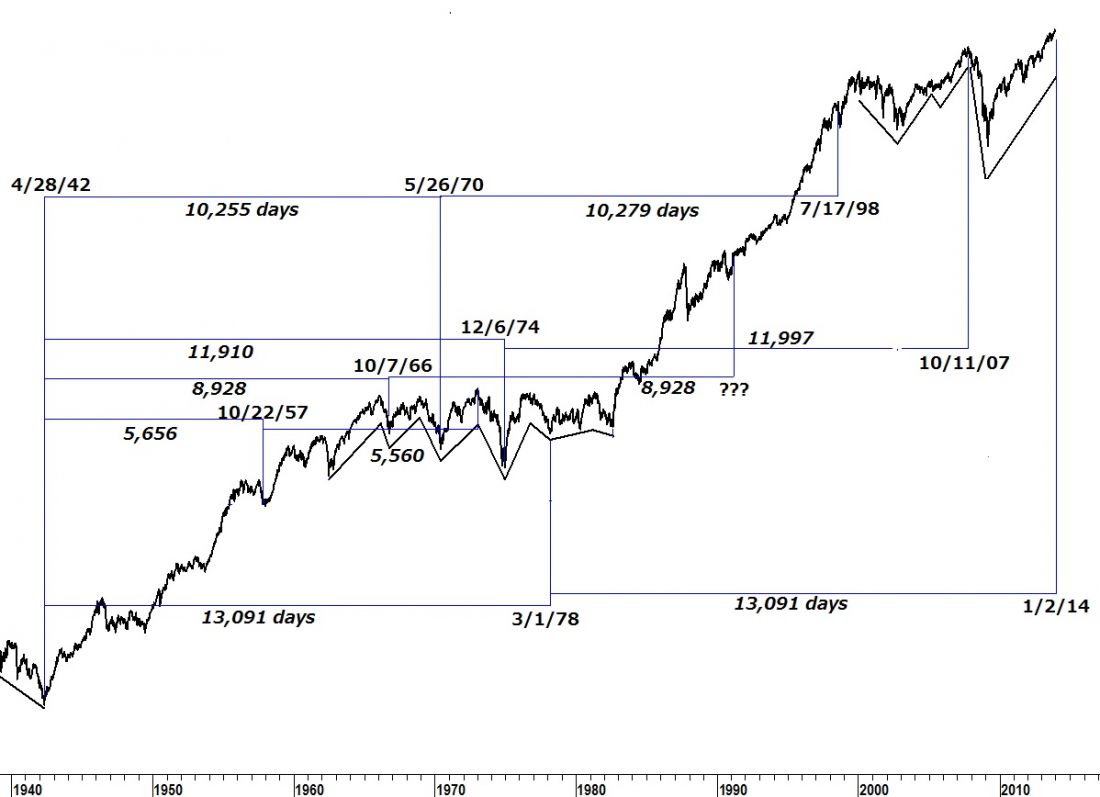
One of the advantages of being at the center of the “Lindsay Renaissance” is receiving information from other investors and analysts, around the world, who have been quietly using the work of George Lindsay on their own for many years. Last week I received the dates shown in this chart.
The dates mark low-low-high intervals. They all originate at the beginning of the 1942-1962 long cycle. Most, but not all, use the lows of the basic cycles during the 1962-1982 long cycle as their turning points.
They are hardly exact forecasts but given the time spans involved, they are very impressive. Only one interval failed; the 8,928 day interval counted from the low of the first basic cycle in the 1962-1982 long cycle.
The current LLH interval points to a top on 1/2/14 and is close enough to both the 11/29/13 high as well as any possible higher high during January to keep me bearish.