

One of the tools I use to determine market direction is a ratio chart of Bonds:SPX. What it tells me, is how traders feel about bonds compared to stocks. Typically, traders will run to bonds for safety when the SPX is dropping or run to stocks when they want to add more risk to their portfolio.
EFFECTIVE TRADING TOOL
The chart below shows the Bonds:SPX ratio chart and when you see the moving average convergence divergence (MACD) indicator cross down, it is a buy signal for the SPX. When it crosses up, it is a sell signal. Pretty simple tool and very effective. It will not get you long at the exact bottoms or short at the exact tops alone and why I combine that indicator with sentiment readings to get an overall picture.
When looking at this ratio tool on a 60-minute chart and putting some Elliott wave counts on the chart, you can see that we are at a pivot point. Either the SPX has already made a failed fifth (that is when the fifth wave fails to move above the third wave) which implies we have already started a larger move to the downside. Or we just finished a wave four down and a wave five up is taking place now.
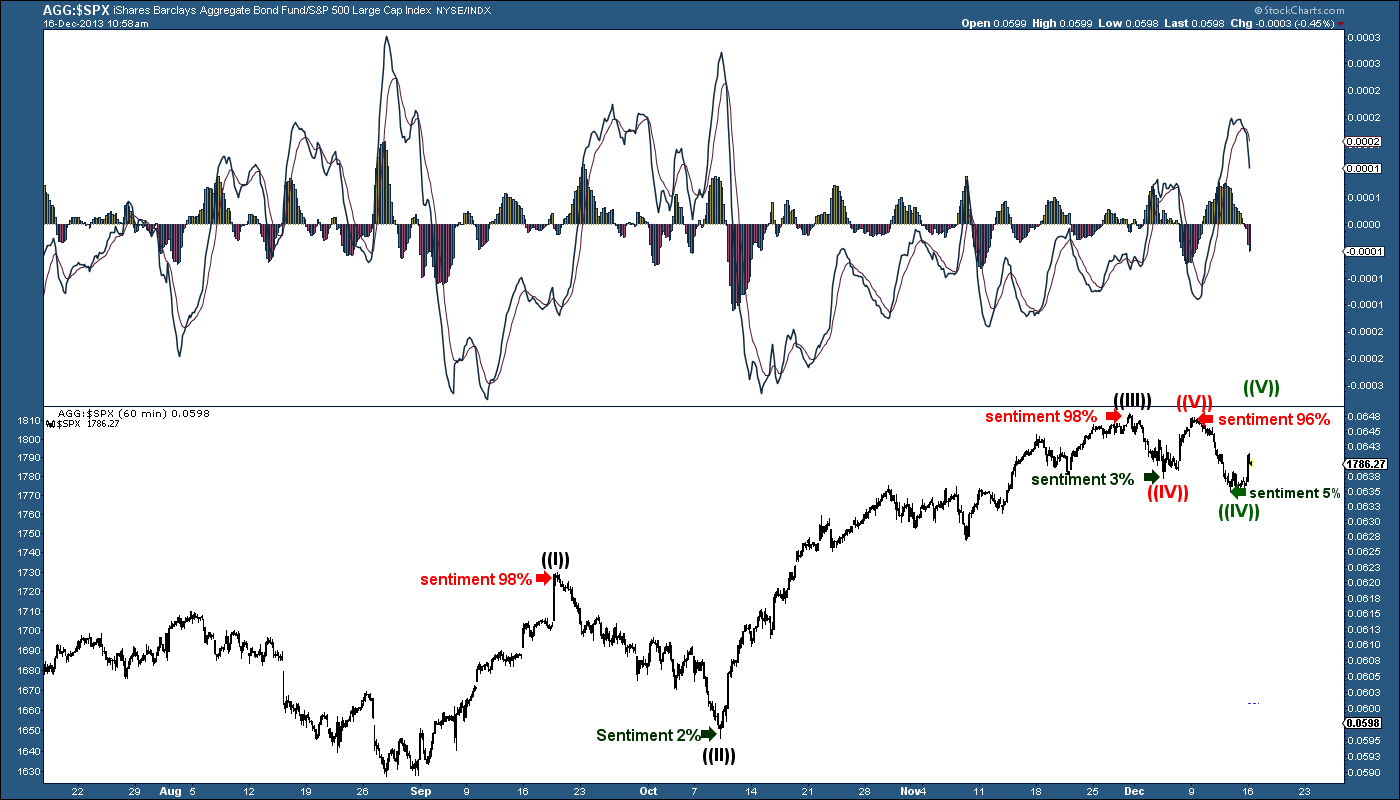
The dangerous part about trading the wave five up (if that is the count) is that we already topped and a very strong wave down is pending once this counter move up completes. Our sentiment data is suggesting that is what is taking place, but for now, the bulls seem like they have some room to move higher when looking at our Bond:SPX ratio chart.
= = =
Click here to receive a free copy of Dean’s weekly sentiment report.

