

In his seminal paper An Aid to Timing (published March, 1950) George Lindsay included a representation of all his long cycles from 1798 until 1949. Each long cycle was approximately 20 years in length and can be divided into two multiple cycles. These long cycles are what we refer to today as secular bull and bear markets.
Twenty years later, in a presentation given to the Society for the Investigation of Recurring Events (S.I.R.E), Lindsay showed how he labeled the major inflection points in his long cycle (see below). Those inflection points are labeled points A-M with the low at point K rising into a Three Peaks and Domed House formation capped at point L and followed by a drop into the final low of the long cycle at point M.
Of great interest is his explanation that the distance between points A and E is 7years, A to J is 15years, and D to M is 12years. Naturally, he didn’t mean these time spans were exactly these distances but a close examination of these long cycles, and those since then, has unveiled a fascinating discovery.
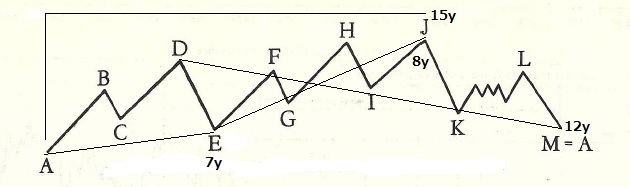
All of the long cycles since 1798 contain a period of at least 7years between points A and E except two. In the long cycle from 1842-1857 the period of time between points A and E was a sub-normal 6years and 7months. At only 15 years the entire long cycle was much shorter than the expected 20year duration.
This situation didn’t occur again until 72 years later during the long cycle of 1914 which should have run at least until the low in 1932 following the “crash of ‘29.” The time between the lows at point A (1914) and point E (1921) was a sub-normal 6years and 8months. Lindsay wrote of a shift in the long cycles during this time. Although the 1914 long cycle should be counted to the secondary low in 1933, the net result is that a new long cycle began at the low in 1921 effectively starting far earlier than expected; the same result as if the 1914 long cycle had ended early.
The implication of all the above is that a subnormal period (less than 7years) between points A and E in a long cycle causes the succeeding long cycle to begin earlier than expected. As an aside, with distances of 72years and 81years between these altered cycles the situation reminds me of the book The Fourth Turning (Strauss and Howe, Broadway Books pub.1997) and its description of the Saeculum. I’ll leave that discussion for another day.
This phenomenon has not been witnessed again until now. The ensuing long cycles were 1942-1962, 1962-1982, and 1982-2002. The current long cycle began at the low (point A) in late 2002. Point E, the low on 3/6/09, is a subnormal 6years and 5months later.
So, is the 2009 low a new point A and the beginning of a new long cycle? Whether this interpretation is correct – or the long cycle which began at the 2002 low is to continue (see March Lindsay Report) both scenarios call for an important low in 2016.
= = =
Obtain your copy of the March Lindsay report at SeattleTA.

