Last week’s commentary, Beyond all Doubt, quickly turned to ‘beyond belief’ as the Dow exceeded its July 16 closing high. The market timing models of George Lindsay don’t use the terms bull and bear market and I shouldn’t have either.
Lindsay Analysis
Rather his work speaks in terms of basic advances, basic declines, and basic cycles. Understanding the difference between these concepts was how he was able to make such incredible market calls during his career.
Recent Market Action
By 7/16/14 the basic advance from 11/25/11 had been ongoing for 964 days. Having reached the end of the longest of Lindsay’s standard time spans, the basic advance had to end and the Dow did turn down from there, falling 770 points. Lindsay wrote that following an extended basic advance (929-968 days) the Dow always climbs into a right shoulder after the initial dip. Lindsay allowed for the possibility that a right shoulder can reach a level higher than the basic advance but it has been very rare to see that happen as it did last week.
What’s Next
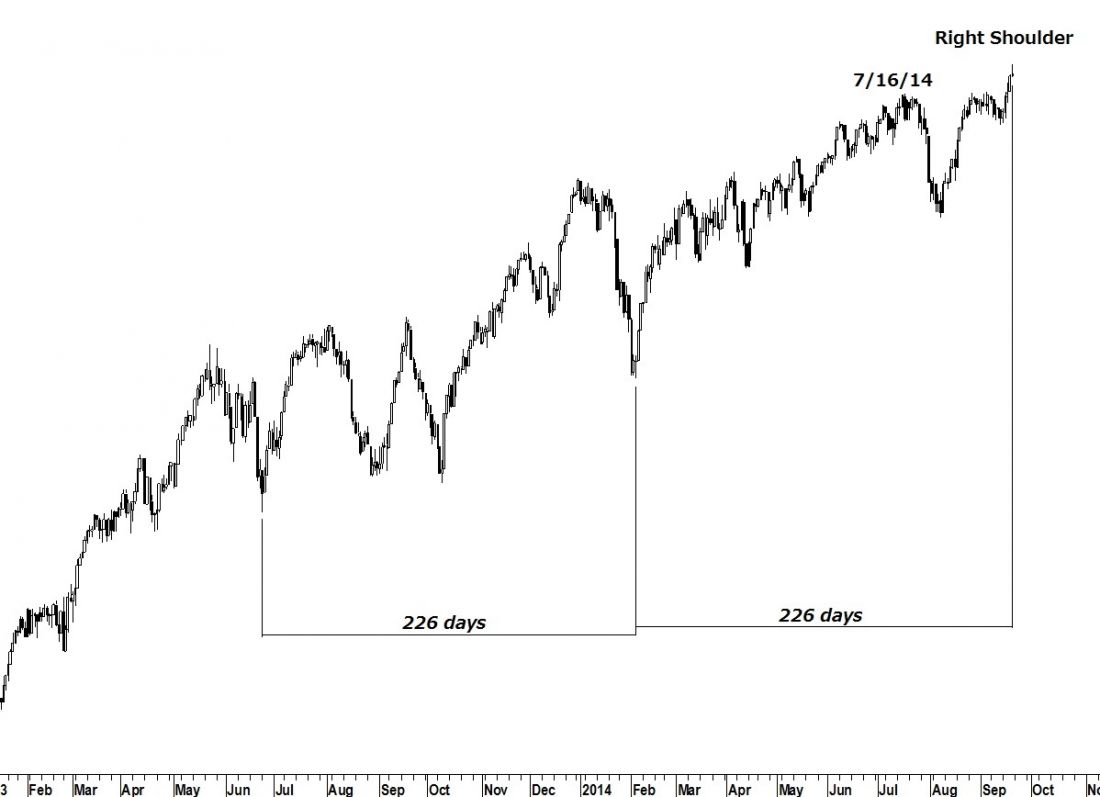
The question now is ‘where is the high of the right shoulder?’ Lindsay wrote that an interval of 221-224 days (give or take) has occurred throughout the history of the Dow. This interval has made an appearance in every previous right shoulder formation.
Today we can see one of Lindsay’s lesser-known models, the low-low-high pattern, is pointing to a high last Friday (it could be off by a day or two). While this pattern can contain any number of days, in this instance it appears as 226 days – just as we are expecting a right shoulder. Consequently, I’m sticking to my bearish opinion and still expect the 2009 bull market to be over in the immediate future if not already.
= = =
Get your copy of the September Lindsay Report at SeattleTA.