

One of my favorite patterns to follow, are bullish and bearish wedges. They are very easy to follow and when you combine the target line, you have a very good idea of where it may be heading.
When placing a target line on a wedge, you want to break the pattern up into 5 waves. The target line would be where you draw the line from the top of wave 1 and the bottom of wave 4.
It really is a very reliable pattern, as once the lower trendline breaks on the wedge that would be your confirmation that the target line has a very good chance of playing out. Right now, that bearish wedge pattern and target line for the Dow, (Dow Jones Industrial Average) is pointing down to the 16,200 area.
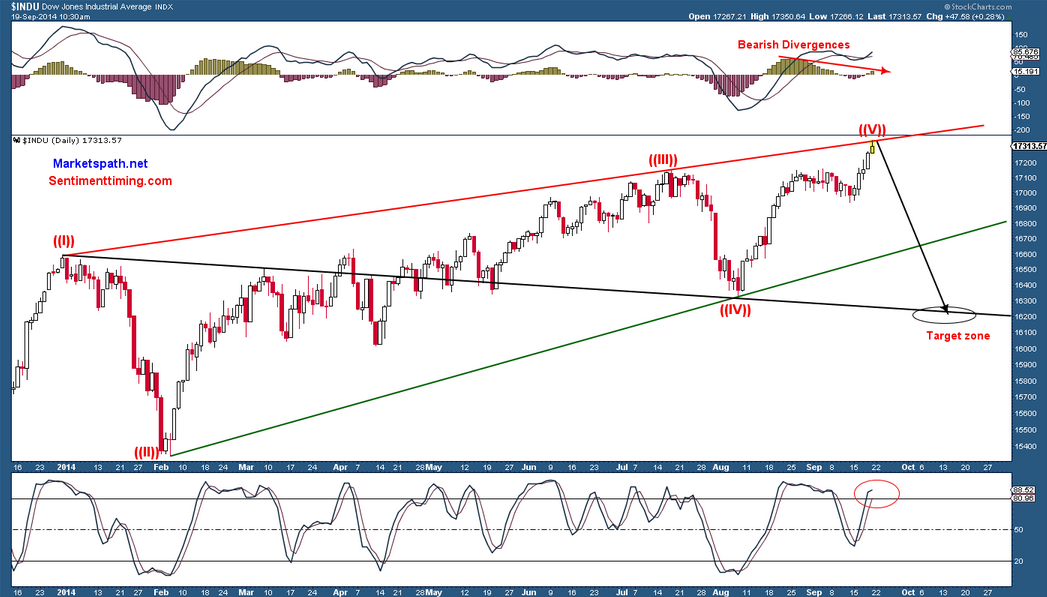
As I mentioned above, these are very reliable patterns, but you would also like to grab as much information as possible, to see if the odds increase of the pattern playing out. The Dow hit the top of the bearish wedge and was also showing bearish divergences, which does support some type of drop. Will it make it to the 16,200 level? We will need to wait and see on that.
Sentiment Profile by Woody Dorsey: “The sentiment profile still infers that the 9/4 price High was only a Momentum or, 3 wave extreme. The weakness into 9/15 was clearly not impulsive.”
“All of this clarity to the recent thrust up. While there are turning points near here and the BABA news is typical of an extreme, the pattern allows upside probes. There is not yet a clear price and sentiment reversal to trade against,” according to Dorsey.
= = =
To see the latest sentiment chart for free: click here.

