
You can look at markets and make trading decisions in many ways. Market Profile® has been an indispensable tool in my trading career. While Market Profile is a lifelong study, three characteristics I use to increase the probabilities of making successful trades are areas of acceptance and rejection, trade location, and context.
Areas of Acceptance and Rejection
The most useful characteristic of Market Profile is how it paints the picture of acceptance and rejection of price over time. It shows important points of possible change in the perception of value. The value area and point of control reveal where the market may be trading in balance and where the extremes of that balance are. This is exactly what the phrase “trade the extremes” refers to. This Market Profile graphic shows a mostly balanced market, the value area, and the extremes.
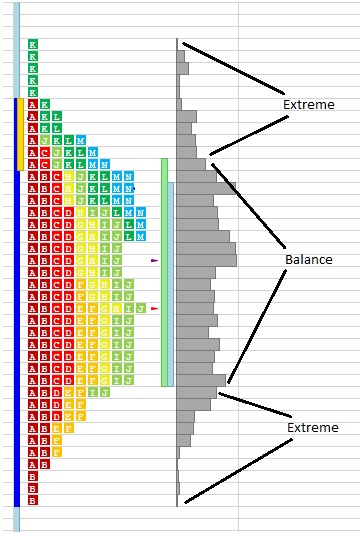
These areas of rejection, or the “extremes,” are where this market was viewed as either “too cheap” or “too expensive” on this trading day. On other trading days, that perception of “too cheap or expensive” may change. At these levels, change will become apparent.
Trade Location
The balance area, or “value area,” represents where the market spent 70% of time on this trading day, leaving 15% of trades below and 15% of trades above. Trades placed in these 15% areas (short above value and long below) have a high probability of returning to value and being covered for a profit. The greatest things about trading these extremes is if the market state changes and the perception of value changes, it is at these levels that the change will become apparent and provide a good way to limit risk.
You will be trading very close to the point of failure for these trades and then given the chance to reassess the market state to try and take advantage of the change. If faced with a loss at these points of failure, a change in the market may be occurring and your strategy may need to be adjusted to fit the new market state.
Context
A trader needs to have a sense of market state and the context of the market. As a trader, you should ask yourself, “Is the market trending or balancing and if so, in what timeframe? Is the context near a critical level and if so, from what timeframe? Is there news coming out that may change the market state?” A strong trend in a short timeframe may just be a normal market rotation in a longer timeframe, so it is always important to be aware of longer term support and resistance areas.
Context is a very complicated concept, but Market Profile can help you organize that information into a recognizable and useable form, even in the day timeframe. Compare the Profile in figure one to the Profile in figure two as an example of a trading day that changes short timeframe context, and perception of value.
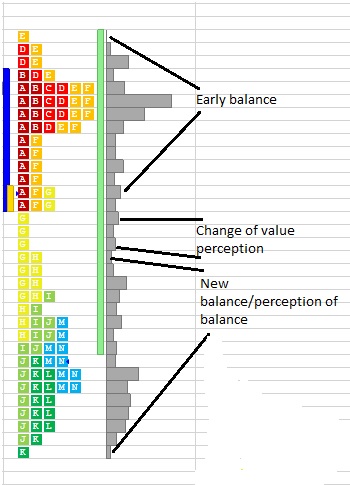
In this example, you can see how the change in market state and context appears in the Profile. The two areas of balance, or acceptance of value separated by a small area of imbalance or rejection, are clearly visible. Notice how each area of balance resembles the bell curve, pointing out the good trade locations as well as the brief change in the collective perception of value.
The Market Profile is a vast and complex subject that can take years to master but there are some simple features that you may begin to apply just as you begin to trade with the Profile. This article briefly touches upon these ideas, so it is my hope that you have a new and better way to look at markets through Market Profile. Take the time to continue to increase your knowledge and intuition with the Profile and you will see the rewards in your confidence and profit.
#####

