
Forecasts for a colder-than-expected winter have resulted in a seven day rally in the US Natural Gas Fund ETF (UNG). This 15%+ gain is now bringing the UNG up to a critical level at the $22.00-$22.50 resistance area.
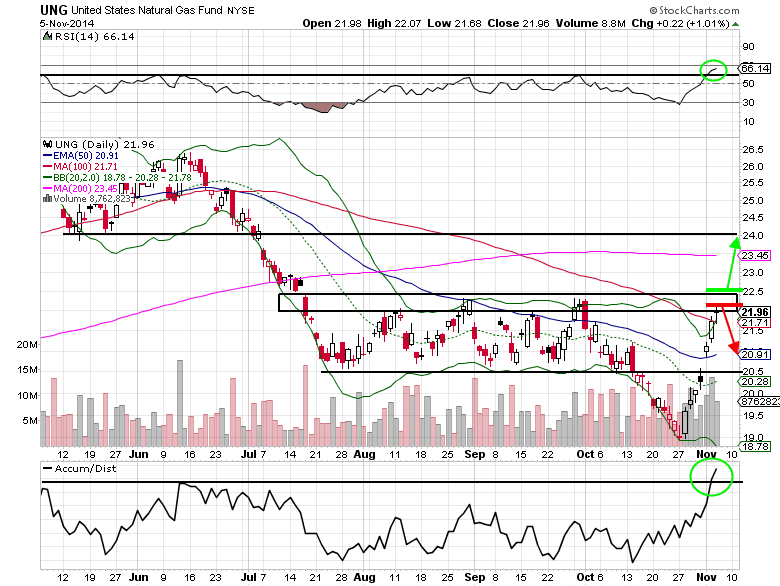
Since the correction that occurred in late spring/early summer took out that level, it has acted as a ceiling for the previous four months. This now puts investors and traders in a tricky situation. For the bulls there are some positive developments via the secondary indicators. Both the relative strength index (RSI) and the accumulation/distribution line are confirming a breakout above the previous highs on the six-month daily chart.
Despite that, if the UNG starts to stall in the current resistance area (a lower close would confirm it), it would be prudent for those long to lock in some profits. For the bears, this would set up a low risk opportunity through the ETF (using a buy stop loss reference above the $22.50 level), or by buying puts/put spreads. The first level of support to look for would be in the $20.50-$21.00 area. These are relevant since the $20.50 was a prior support level from July to mid-October and $21 is near the 50-day exponential moving average. If both fail to hold, it would likely mean the UNG revisits the $19 level from late October.
On the other hand, if the UNG’s bullish momentum persists and breaks out above the $22.00-$22.50 level, there isn’t any major resistance until $24. This means there could be another 6-9% of upside potential this year at a minimum. Noted earlier were the breakouts in the secondary indicators, but also the seven straight higher intra-day lows shows that the bulls are still in control for now.

