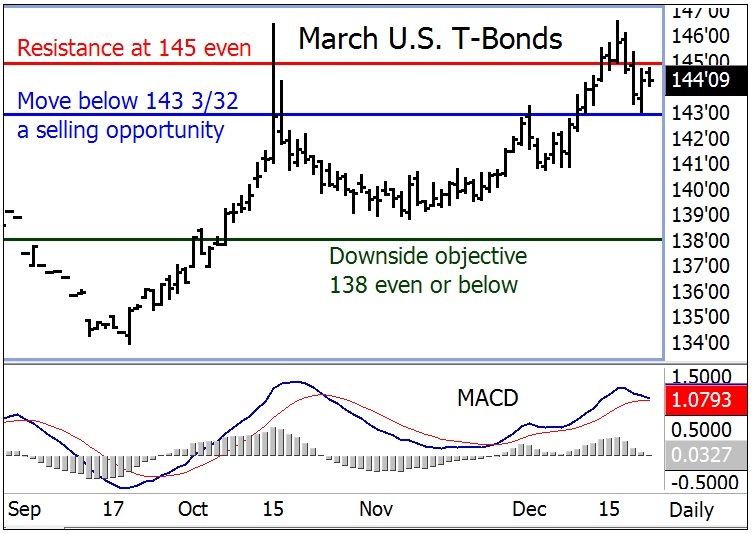
March U.S. T-bond Futures a Selling Opportunity on More Price Weakness
See on the daily bar chart for March U.S. Treasury bonds that prices have backed well down from last week’s contract high as the bulls have faded. See, too, at the bottom of the chart that the Moving Average Convergence Divergence (MACD) indicator is poised to produce a bearish line crossover signal. See in recent months how well this indicator has worked at forecasting price trend changes. A move in prices below chart support at Friday’s low of 143 3/32 would give the bears fresh downside momentum, would likely produce the bearish MACD line crossover signal, and would then also become a selling opportunity. The downside price objective would be 138 even, or below. Technical resistance, for which to place a protective buy stop just above, is located at 145 even.


