

I have recently focused on the options-skew index as a tool to help me define overbought/oversold markets. It is not the most conventional or even cleanest tool, since we’re talking about outlier trades. By definition, the options-skew index measures the tail risk of the SPX 500 basically over 30 days. Traders who add to the skew are looking for outlier moves of 2-3 standard deviations, which happen 5% or less of the time. These are cheap bets, but, if they come through, they pay off nicely.
So, why did the markets sell off so hard this week? Was there something bad in the water? Actually, no. The skew index was spiking as traders were making large bets on an outsized move. They got it, at least temporarily. The index hit a high of 138 last week, which has been an area where trader bets on a decline have been accumulated recently. Skew is a great way to play a market that has elevated volatility.
I utilize several different tools such as the VIX, put/call ratio, rydex ratio, and polls to help me judge sentiment. The skew index has become a reliable tool as well.
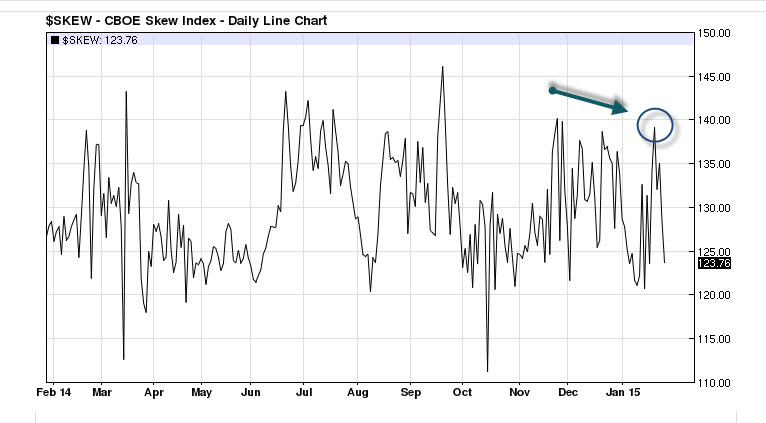
The skew index pops higher when complacency is high. We saw this happen often in 2014, and many times led to a sharp decline in the markets within a couple weeks. We just saw a pretty high reading last week, coinciding with the big rally through the ECB quantitative easing announcement. Now, as a momentum trader, one would consider a strong move and follow through as a trending move, however, the sharp moves higher in the markets are stopped right in their tracks.
This indicates a market under distribution, a lack of commitment to stay invested in this market, and high degree of nervousness and worry. If there is anything a market hates it is uncertainty, and the options-skew index spiking higher is a great signal of things to come.
#####
If you want to learn more about Bob Lang and his subscription service,Explosive Options, please click here.

