

The ability to gauge the genuine strength of a move in a market has a number of implications. We can assess the strength of a move in one direction against the strength of the last move to decide if a market is reversing or just pulling back. We can also look at a move in more absolute terms. Armed with knowledge of how that specific market generally operates, we can assess if what appears to be a good move (in price action terms) really has a chance of being sustained.
An understanding of the mechanics of price movement is also an important factor in assessing strength. This is not “Why are people buying?”, but “Why does price move at all?” Or maybe a better question is “Why doesn’t a market trade at 90.56 one second, then 10.50 the next and 1900.10 the next second?”
The reason price moves in an orderly fashion is the presence of liquidity, the presence of a seller to buy from or a buyer to sell to. Liquidity is also known as limit orders, bids, or offers. The market moves up because the offers above have all been traded. They have been “consumed” by market orders. Buyers need to buy from the next offer up and so price moves.
The consumption of liquidity is key in assessing strength? Buy-side liquidity exists at the inside bid and below and supports a market. If buy-side liquidity disappears, the price drops. For a market to move down, sellers must consume that buy-side liquidity. At the low of the day, buy-side liquidity is at its thickest. Buy-side liquidity is also thicker at any level the market agrees is a significant area of support. It only exists below us; there is no buy-side liquidity above the market price. Limit orders to buy become actionable if they are placed above us and will effectively become buy market-orders as soon as they are placed. With no bids above us, as a market moves up, especially a fast moving market, it takes time for that buy-side liquidity to establish itself in the wake of the move up.
Many times, countertrend moves are nothing more than a relative lack of liquidity after a move in one direction. This “liquidity vacuum” is enough to see prices collapse back momentarily. On a price chart you will see a countertrend move but the move will not exhibit signs of strength. If you can recognize countertrend moves that lack strength, you can capitalize on them.
My personal view is that price-based indicators of strength are not showing another dimension of information so we shall leave those to one side. What we really want to analyze is the amount of participation in a move. This will allow us to assess if any swing in price is a pullback (liquidity vacuum), a new move initiating, or just a weak move in an overall range-bound market.
If participation is higher, then volume should be higher. That’s the volume in the move, not necessarily the volume in any individual price bars.
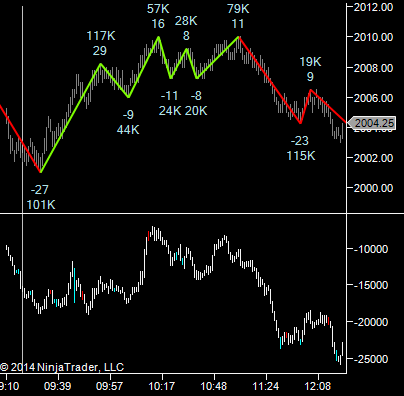
In this case, we can see the volume of each swing on a simple Zig Zag indicator (most platforms have one). The coloring here helps us see where the volume is. An upswing will be green unless the prior downswing traded more contracts. This is the E-mini S&P500 Futures on September 5th, 2014.The white vertical line shows the session start time. We first see a swing up of 29 ticks and 117 thousand contracts.
Taken on its own, this first swing is somewhat bullish. After this, the upswings do “outsize” the downswings in volume, but not by any significant amount. This is not indicative of a market where participation to the upside significantly. We have an initial move off the open with some participation, but with no follow through.
On the bottom half of the chart we have the cumulative delta (buys at market minus sells at market). In absolute terms, we expect a 10-thousand contract shift in delta on the first leg of any new intraday move on this market. What we have here is a very weak move in delta, the range is small, and it’s not directional. From a delta perspective, there’s no real sign that buyers are out in force. In short, this move does not look like it has the strength to continue upwards. That doesn’t give us a cast-iron guarantee it will reverse, but it does tell us to be cautious about trading to the long side.
If we look at what happened next, we got a push down with 115-thousand contracts and 23 ticks. The delta also came down 15-thousand contracts. We then pulled back 9 ticks trading 19-thousand contracts. You could look at this and say “The market was weak. It only took 19-thousand contracts to move the market 9 ticks when it took 116-thousand to move it down 23 ticks”. What this move up represents is simply the impact of a relative “liquidity” vacuum, above us, as real offers took time to come into the market and provide resistance in the wake of the move down.
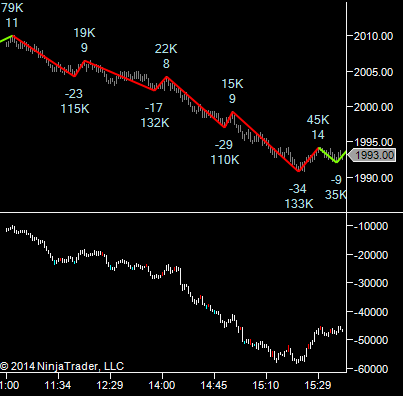
We also see the delta moves down 15-thousand contracts. As mentioned earlier, when we see a delta shift of more than 10-thousand contracts on a swing in this market, it’s a sign we need to shift our bias and look for continuation trades.
As the market moves down, we can see much more participation to the downside, in terms of contracts traded. The delta is confirming that by showing the mix of market orders (that consume liquidity) is also biased to the downside.
Assessing the participation in a move gives you an edge over those just looking at the price-based indicators.
This method of analysis will allow traders to better distinguish early on whether a move is a pullback or a reversal. In addition to that, it will help those that are continually trying to fade a market to stay on the right side of a move.
For more from our new writer, Peter Davies, and to learn about JigSaw Trading, please click here.

