

It is time to get an update on the health of the US consumer. A look at oil prices, the latest Wage and Salary data by the Bureau of Labor Statistics, and the long-term view of the US Treasury market will give a sense of how the US consumer is faring today.
Oil and the Markets
Since finding a top this summer, oil has fallen like a heavy knife. The last time oil dropped this quickly was the summer of 2008. By the fall, US markets had followed suit. So far, US markets have not followed the path of oil. Despite this, oil’s weakness is spooking equity traders, which can be seen in the sideways action of the S&P 500, since it found a high in early December.
In recent weeks, light-crude futures has slowed its trajectory and is hovering at around the $50 level. This is the price area it consolidated for the first time in the spring of 2009, after finding a low in early 2009. It is important to note that while light crude futures has not fallen further in recent weeks, it is still trading below its 10/50 day moving average, so the market may need further confirmation that oil will not continue lower.
Wage and Salaries 2014
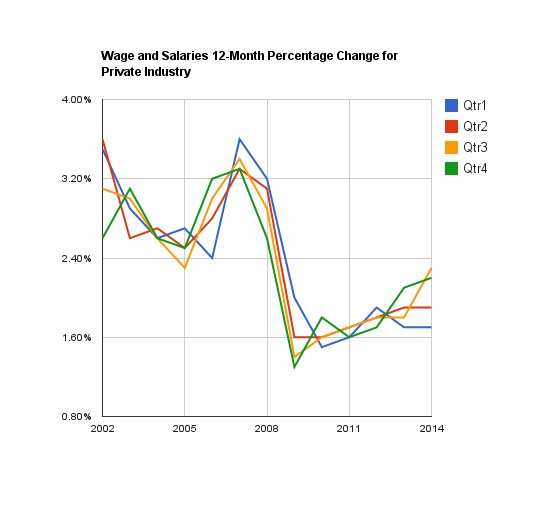
Below is the Wage and Salaries Chart shared this last November. It has been updated per the latest recordings by the Bureau of Labor Statistics this January for the 4th quarter for 2014. In early 2014, the US consumer saw little improvement in wage and salary growth. However, Q3 and Q4 saw the consumer enjoy a relatively sharp uptick in wage growth, the highest since the Financial Crisis in 2008. Although wage growth is still near the decade’s lows, the US consumer is steadily on the mend. No doubt the consumer is also enjoying these lower oil prices.
Figure 1, Wage and Salaries 12-Month Percentage Change for Private Industry Provided by Bureau of Labor Statistics
Have US Treasuries Found a Top
Last September was the sixth anniversary of Lehman Brothers filing Chapter 11. Since the market bottomed in early 2009, the financial sector has lagged behind the broader market, but then in September, with interest rates on the mend, I shared in my article, the Sixth Anniversary Of Lehman Collapse: Time To Watch Financials, that it may be time to look at the sector again.
Unfortunately, problems in the global economy, as depicted by weak oil markets, contributed to investors’ fears. Then this November, oil shockingly fell below its 2012 lows, lows that had served as a steady support since the pivotal European Summit of 2012. Back then, oil’s collapse saw traders move to the relative safety of long-term US Treasuries.
Today, while oil traders argue whether oil will go any lower, it is time to look again at the TLT (20+ year US Treasury) to get a sense of what traders are thinking today.
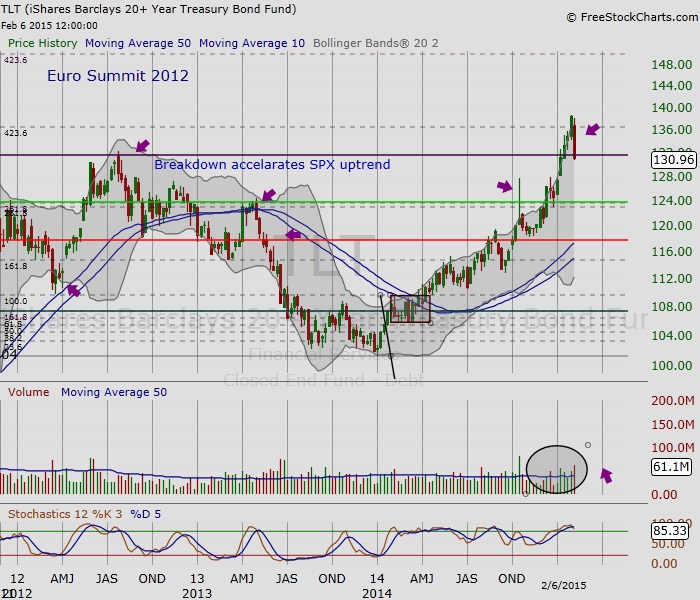
The chart below shows the TLT breaking above the highs of 2012. However, last week, the TLT, in above average volume, retraced back near the summer 2012 highs. No doubt, this scenario is an encouraging sign for oil traders and equity traders alike, many who have been nervous about oil’s weakness and the health of our trading partners.
Figure 2, Weekly Chart of the TLT (20+ US Treasury) by FreeStockCharts.com
Take Away
This year, 2015, is so far shaping up to be a lackluster year when compared to previous years. Much is due to uncertainty about the strength of the slow global recovery. This fall, weakness in oil and problems in Europe were again cause for concern. Intermarket history between oil and equities reminds us that oil weakness should not be ignored.
In 2008, oil’s peak and fall, led the equities collapse just two months later. However, unlike 2008, wages have been on the uptick. In fact, the last two quarters of 2014 saw wage growth at its best since the Financial Crisis of 2008.
Oil has traded sideways in recent weeks, slowing a trajectory that began last summer. However, light-crude futures continues to trade below its 10/50 day moving average, a caution that it may still be too early to call this a low. Finally, the TLT (20+ year, US Treasury) may be telling us that for now, the flight to long-term bonds has found a peak. It may be time to focus on the consumer, and on which sectors will benefit from their health while we wait for oil to make up its mind.
#####
Related Reading …

