The energy sector has been out of favor since the middle of last year, and stock prices for oil and gas drillers have been have been decimated with the S&P 500 oil and gas drilling industry falling almost 60% from its peak last year. This move is largely driven by the bear market in crude oil, and the underlying market fundamentals haven’t seen a substantial improvement. The Baker Hughes oil rig count has fallen dramatically, matching the rapid deterioration last seen in 2008 and 1986. One would expect that to have a positive effect on oil prices, but the rigs that have come off-line are said to be the least efficient rigs and production remains robust. According to the EIA, almost 9.5 million barrels are still produced daily in the United States, and Saudi Arabia has yet to blink in terms of production cuts, producing 10 million barrels per day.
According to Oil Market Intelligence, the latest supply/demand dynamic does not favor higher oil prices. According to its research, global oil supply increased 2.5% year-over-year last month, while demand increased just 0.7%. The EIA stated that the 466.7 million barrels of U.S. crude inventories is at the highest level for this time of year in at least 80 years.
On the surface, the lousy fundamentals would have this prudent investor avoiding the sector, except there have been quite a few smart folks turning positive on the space. Robert Shiller thinks it’s a good time to buy oil, T. Boone Pickens raised his oil price forecast to $100 per barrel by the end of next year, and Paal Kibsgaard, the CEO of Schlumberger hinted towards firmer oil prices ahead.
Higher oil prices will hinge on production. Goldman Sachs forecasts oil production to level off by the end of this year and sees a much more subdued rate of production growth into 2016. This mindset is shared by the above mentioned experts – production will drop off suddenly and will be difficult to reverse once it starts. We are already seeing evidence that the possibility of production cuts will start to take place. According to Moody’s, in aggregate, they expect exploration and production companies to cut capital expenditures by 41% this year. This is already being reflected in the weaker durable goods CAPEX figures in the U.S.
Certainly, the smaller players may soon face forced shut-downs as they succumb to default within the high-yield debt market. Moody’s states that a full 14% of companies rated as “junk” status are within the oil and gas arena, up from an average of 8%, and we are already starting to see some of the early casualties.
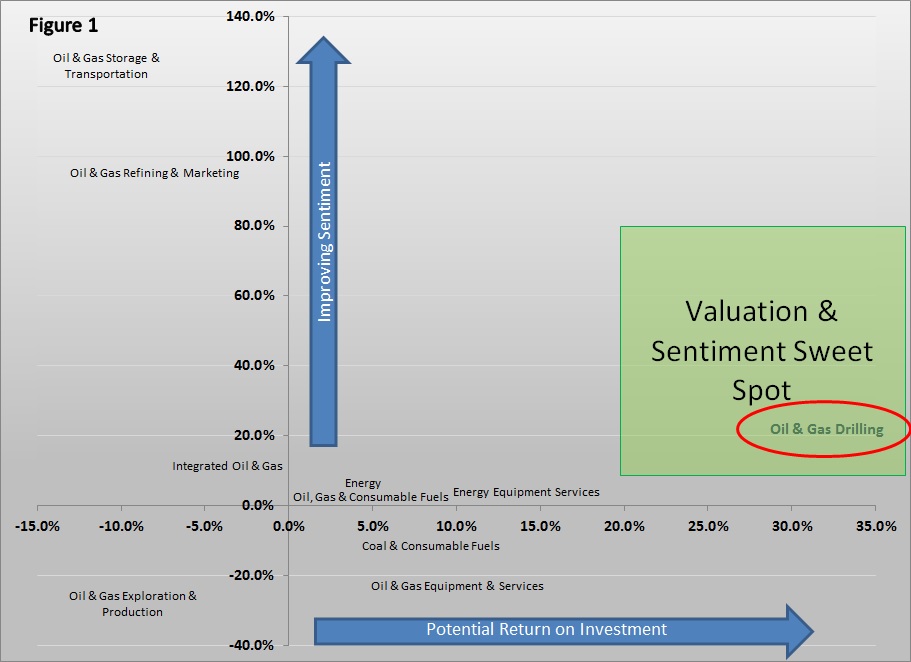
So let’s assume production will start to level off as the year progresses and quite possibly start to decline into next year. Then it would make absolute sense to start looking at the oil and gas space for potential value and investment opportunity. Going against the grain of the Efficient Market Hypothesis, this investor believes the market is a function of intrinsic value plus investor sentiment. Examining the underlying fundamentals of the industry and tracking investor sentiment can offer insight as to the appropriate entry point. The scatter plot in figure 1 below attempts to track both in order to find those companies that lie within the “sweet spot”. The x-axis represents return potential over the coming 12 to 18 months and the y-axis shows us investor sentiment for the industry.

After running the analysis we found that the S&P 500 oil and gas drilling industry is indeed lying in that area that warrants building a position.
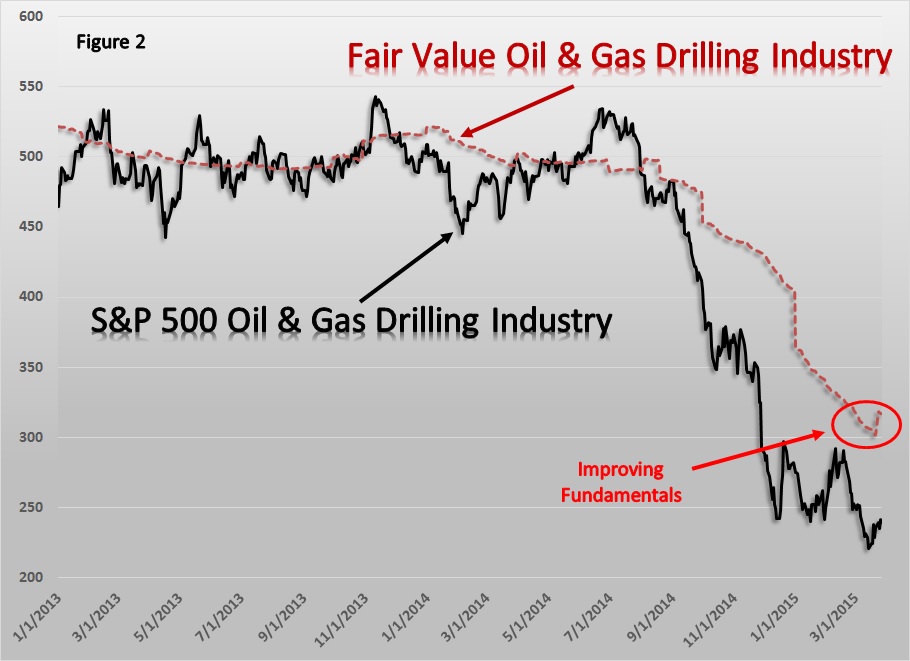
The x-axis measures return potential over the coming 12 to 18 months. We calculate this figure by combining valuation methods derived from the income statement, balance sheet, and statement of cash flows. We track the historical price to earnings (P/E), price to book value (P/BV), and price to cash flow (P/CF) ratios and weight them according to accuracy and relevance to come up with a fair market value. According to the latest readings, it appears the S&P 500 oil and gas industry is offering 30% upside, and, according to figure 2 below, it appears the fundamental picture has started to improve of late.

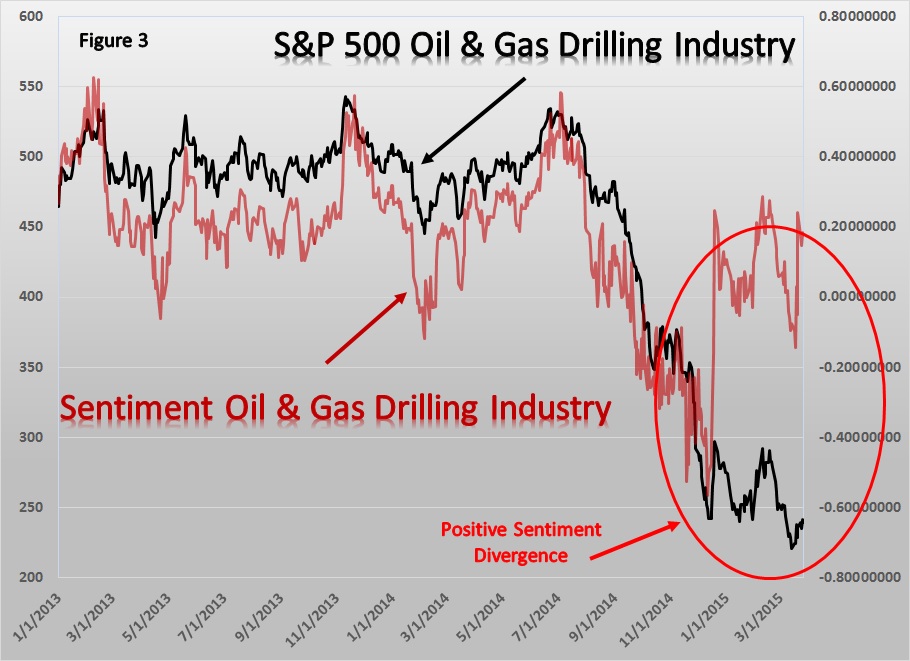
On the sentiment side, it looks like sentiment washed out in December last year, and while the price of the industry has violated its December lows, sentiment remains elevated, creating a serious divergence between the two measures. The sentiment measure takes into account pricing and volume. Down days on excessive volume are given greater weight than down days on lighter volume. Up days on strong volume are given greater weight than up days on lighter volume. On the chart, it still appears the bears are in control but their control is diminishing and this sets up a potential for a rally (figure 3 below).

We will seek out those companies within the industry that offer the greatest fundamental and sentiment profile and be prepared to act quickly at the first signs of production declines.
#####
More Reading From Joseph Kalinowski …
Look To Platinum And The PGM in 2015


