

Yesterday
Tuesday (Apr. 7) we said we wanted to see some kind of follow-through to the big rally in the S&P 500 mini-futures (ESM5) that rocketed the market higher. Now we know – there wasn’t any. The first-of-the-month pop is beginning to look like just another algo-driven gambit to run the stops and fleece the rubes. We’ve seen this movie before, way too many times.
Yesterday, there was a little rally right off the open, and it looked like the futures would be able to manage a third consecutive winning day. But, by the close, the buying evaporated, and the market closed bearishly near the low of the day. The final price was 2068.25, a loss of about five points, on light volume.
Not even notoriously encouraging remarks by a Fed Governor suggesting QE4 would be justified was enough to arouse the buyers. They are waiting for the Fed minutes today.
Today
The minutes of the last FOMC meeting will be released today in the middle of the trading session. Alcoa releases its first quarter earnings after the close, in the unofficial start to the next earnings season. We’re likely to see more volatility today, mainly predicated on events that are extrinsic to the market.
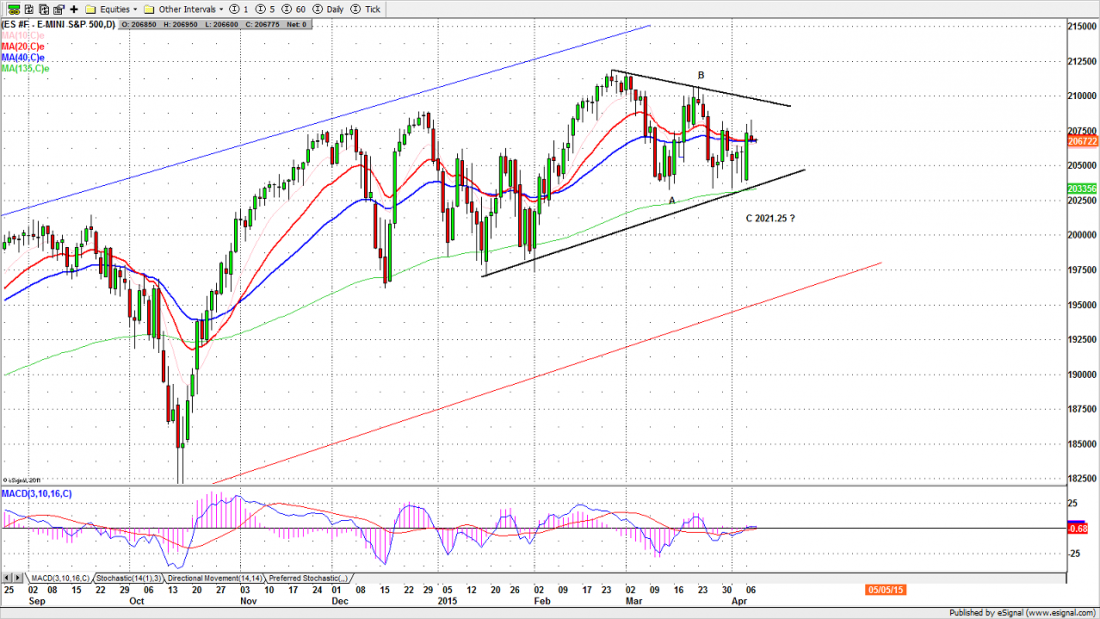
To the extent that the internal logic of the market is still a factor in the way it moves, we should note two technical elements – a large triangle pattern developing on the daily chart, and the overlap of the 20- and 40-day moving average lines.
The converging moving averages act as a pivot, and the price will tend to fluctuate around them, sometimes in big, wide swings, and as the price moves into the narrow end of the triangle, the possibility of a sharp break-out move – in either direction – increases dramatically. Don’t expect a quiet, calm march to new highs. We could get them, but not without some strife.
The 2082.75-81.75 zone is today’s first major resistance. As long as this area holds the market down, ES still has a chance to move back down to revisit 2039.50-43.50, which would fill last Friday’s Globex hole. But only a break below the 135-day moving average line (currently 2033) will be truly bearish.
- Major support levels: 2045-43.25, 2035.50-33.50, 2028-29, 2015.50-14.50
- Major resistance levels: 2082.50-79.50, 2088.75-89.50, 2096-98.50
ESM5 Daily Chart, Apr. 7, 2015
Naturus.com publishes a free weekly analysis of US equity indices. To get on the mailing list, please click here.

