

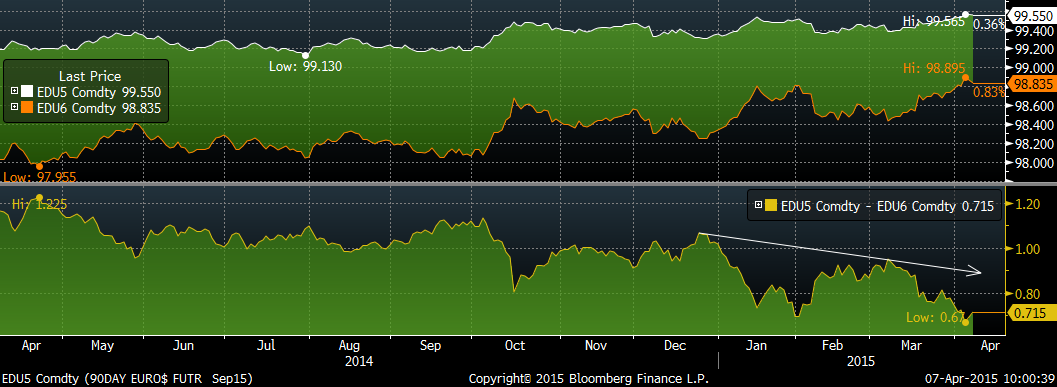
I have previously posted that eurodollar one-year calendar spreads in the front end of the curve give a good indication of the market’s perception of tightening, and how these one year spreads have compressed over time, as Q1 data has been weak and the employment report caused further re-pricing in terms of rate hike prospects.
As a quick review, Sept ’15 to Sept ’16 (EDU5/EDU6) spread was over 100bps at the beginning of the year and closed at this year’s low of 67 on Friday’s weak employment report. This spread has been the peak one-year, as the market has perceived the onset of Fed hikes over that time frame. In a simplistic sense, the move in the spread from 1% (or 100 bps) to less than 3/4% reflects the idea that there were four 25 basis point hikes expected over the course of the year, and now only three are expected.
However, now I would like to mention the slope in the back end of the eurodollar curve. For example, EDU6/EDU8 … this is a two year spread.
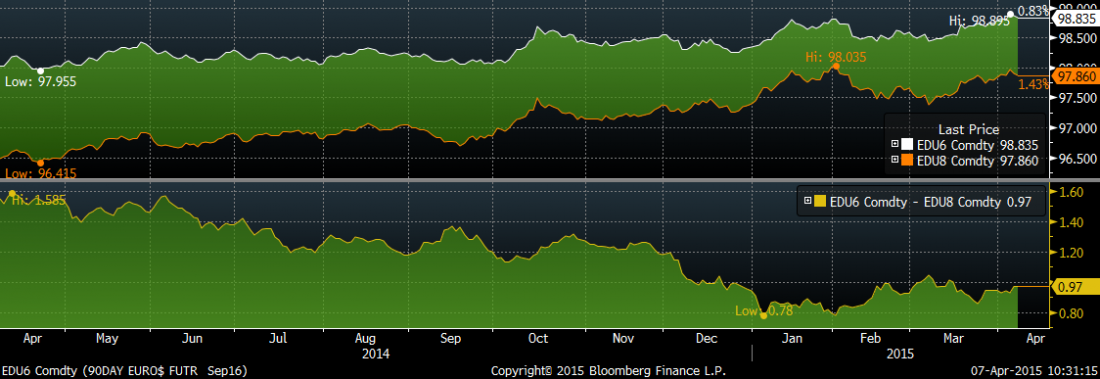
The important things to note from the above chart are 1) that it has generally firmed over this calendar year and 2) that in the early part of January, both spreads were the same level, around 78 bps.
So, why would a two year spread be at the same level as a one-year spread? Again, the eurodollar curve reflects several factors: the pace and duration of Fed hikes;, the idea of QE holding down rates at the longer end of the curve; and longer term inflation expectations. Dudley (head of the NY Fed) yesterday cited foreign QE as a reason that the long end of the US curve has maintained a bid. If the ECB is buying long-dated paper and driving yields to zero or even negative, then longer-dated treasury yields look very attractive to foreign investors, and this in turn is reflected in a flatter back end of the dollar curve.
Let’s take a look at inflation. There are two big intertwined drivers of the deflationary story recently, the strong dollar and the decline in oil. Oil made its initial low in late January and then tested that low in mid-March. On Jan 29, May Crude closed 4644 and on March 17 the close was 4519. However, as of mid-day Tuesday the price was 5375. In fact, next May’s price (CLK’16) is another $6 higher. So if oil has bottomed, then comparisons over time are likely to push inflation readings higher. In addition, at least in Illinois, regular gasoline prices were $2.00/gal in late January, but are now over $2.50 ($2.56 at the latest reading, or 28% higher).
State Street Research PriceStats, which measures online prices, shows a solid bounce in prices from the beginning of the year. While wages may or may not strongly contribute to the idea of increased inflation, year-over-year comparisons in energy prices will almost certainly boost price data. Another factor is that the dollar has begun to turn. The DXY made its high in mid-March and has eased over the past couple of weeks. While US data has been soft, data from the EU has recently surprised to the upside.
In some ways, I think of the eurodollar curve as a tube of toothpaste. That is, if employment prevents the Fed from hiking now (and the front end of the tube is compressed), then it will certainly be hiking later (causing a bulge in back). In early 2013, the front end of the curve was flat and the back was steep, because the idea of Fed hikes was far in the future. Then Bernanke introduced the idea of tapering and the nearer part of the curve became steeper. Given weak employment data, the market is again pushing back the prospect of tightening, which should cause the spreads to widen further back on the eurodollar curve.
#####
For more information on Alex Manzara, please click here.

