

Volume Profile is most useful during pullbacks, not when markets are making forays into uncharted territory. For that super bullish phase, I use Fibonacci extensions and weekly pivots.
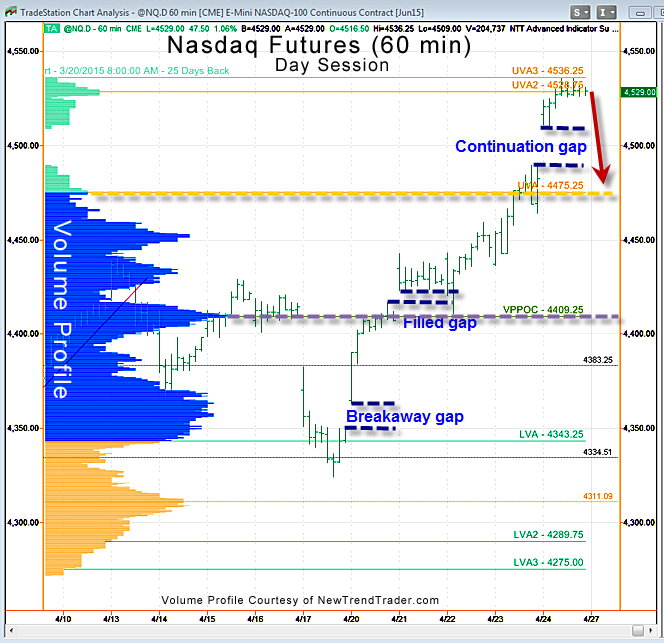
One of the best ways to use Fib projections is to look for a confluence from two different ranges. We have a Fib confluence (127% and 162%) around the 4532 area, which happens to be where the futures are trading on Sunday evening as I write this. There is also a weekly half pivot here, so a pullback to close the last gap shown on the chart would be normal.
The downside target is the gold line at 4475, which is the lower boundary of the Upper Value Area. The Upper Value Area is the price zone between one and two standard deviations above the Volume Point of Control, the purple line at 4409. The Upper Value Area is colored light green on the chart and has a gap.
Mondays tend to belong to the bears, so keep alert in case we get a reversal during the first 90 min.
A Note on Volume Profile
The histogram on the left side of the chart shows the volume distribution in the Nasdaq futures for different periods of time. Key support and resistance levels are indicated by the peaks and troughs.
###
If you would like to receive a primer on using Volume Profile, please click here: www.daytradingpsychology.com/contact
For more articles like this:

