

Last week
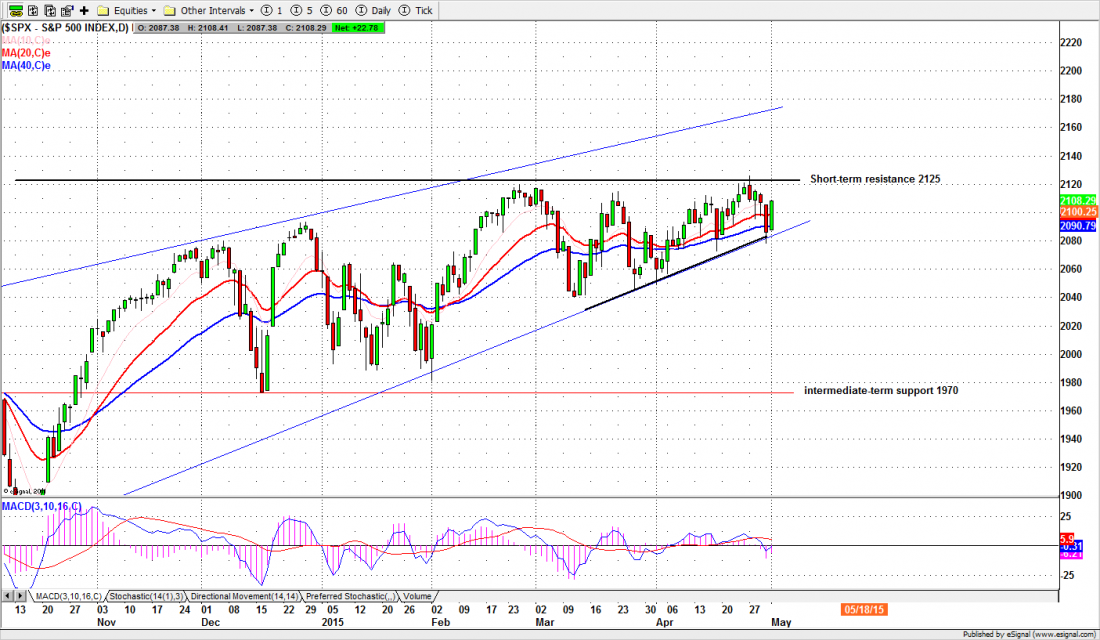
The S&P500, the large-cap equity index, ended last week at 2108.29, down almost 10 points on the week, but up 16 points from the previous day’s close. The index dropped almost 50 points from Monday’s high to Thursday’s low, then recovered 62% of the decline on Friday (May 1).
This back-and-forth is making traders paranoid. The market makes a new all-time high on Monday (Apr. 27) at 2125.92, then drops like a rock to end the month, only to rally 20 points on the first day of the new month – with very light volume — and close at the high of the day.
Traders are having a hard time making sense of this. The new high is encouraging. But the market still hasn’t broken decisively through the resistance at 2125, and it did break below previously solid support at 2090 and 2080. It also fractured the support around the 2014 high at 2093, which triggered a rash of selling programs and trapped a bunch of unhappy shorts who are now stuck below 2100.
So April ends with a tiny 0.8% advance, and only an unlikely buying panic on a day when Europe and much of Asia were on vacation prevents the bloodbath from extending into May. The decline doesn’t do any real damage to the long-term bull market, but there sure isn’t much to cheer about.
This week
Despite all the fretting we are still long-term Bulls, and even a little optimistic about the short term. We are moving into the summer season and the usual “sell in May and go away” seasonal pattern may result in some adjustment of the long-term trend.
But we don’t expect too much selling from that adjustment. The intermediate-term support should be able to hold the index up even if there is a short-term correction.
And the long rectangular range from 2125 to 2040 has held now for three months. The longer the index holds in that range, the stronger the explosion when it finally breaks out, and there is still a little time left before the summer doldrums. We have our change-in-trend days at May 11 and May 26.
However the room on the upside is also limited. 2168-78 could be the ceiling if the index does push through the top of the current sideways range and make a range breakout move.
From now to May 26 the yearly pivot zone 2055-45 is the key area. As long as any short-term pullback doesn’t break below that zone we expect more movement on the upside … for a while.
This week the focus will be on a speech by the Fed Chair on Wednesday and the Non-Farm Payroll report on Friday. The Street expects US unemployment will continue edging lower, and the equities to continue struggling to make a new high.
The SPX has been moving inside a rising wedge pattern on the daily chart, and that wedge is becoming more and more narrow. A breakout is due – one way or the other.
ESM5
The S&P500 mini futures (ES) had the same low-volume bounce on Friday. This week we need to see some follow-through to the upside, ideally (for the Bulls) with a breakout above 2122-23. A failure to break out could mean a return to Friday’s low in the area of 2090-92, and perhaps a shot at filling the gap at 2079.
Major support levels for Monday: 2070.50-75.50, 2062.50-64.50, 2045-50;
major resistance levels: 2115.50-18.00 and 2123.50-2121.75.
###
Naturus.com publishes a free weekly analysis of US equity indices. You can get on the mailing list at this link.
For related reading:

