

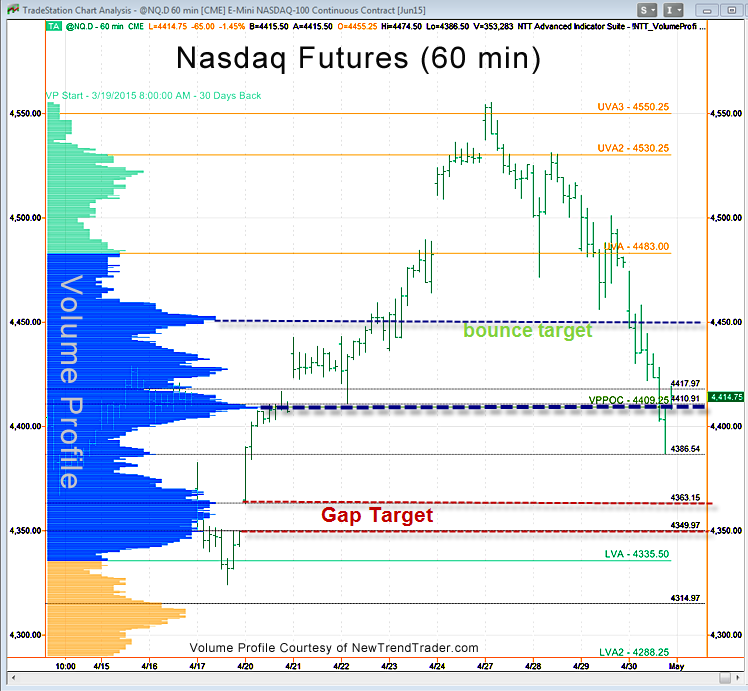
On Friday we enjoyed the expected bounce, which overshot my 4450 target by about 17 points. That’s a bullish development, because the 4450 level is a High Volume Node, which means we should expect selling there when testing it from below.
The Nasdaq futures ended the week on a high note, at the Weekly Pivot (4469). This is a balance point for the market. I say that because there are numerous key levels above and below, indicated on the 60 minute chart of the day session.
If the market remains on a gap hunt, then we should see action down to 4350-4363. If the correction is over, then the market must close an hourly bar above the 4469 level. If that happens, then the Speedzone would then be in play.
###
A Note on Volume Profile
The histogram on the left side of the chart shows the volume distribution in the Nasdaq futures for different periods of time. Key support and resistance levels are indicated by the peaks and troughs. If you would like to receive a primer on using Volume Profile, please click here: www.daytradingpsychology.com/contact

