

So far 2015 has been a difficult environment for investors as the indexes have “chopped and slopped” in a mostly sideways range since December of 2014. Each time the market has appeared ready to bust out to new highs and begin a potentially strong, new trend to the upside, it has backed down into its prior price range relatively quickly. Conversely, each time the market has looked like it is ready to split wide open on the downside it has suddenly found its feet and turned back to the upside. This has led to a highly “channelized” environment that makes life tough for trend-following investors as leading stocks exhibit characteristics specific to such a trendless environment. But these are merely difficulties left to be conquered by shrewd investors. Let me explain.
In the midst of this environment we have seen the rise of what I like to call “Ugly Duckling” set-ups that occur at points within a stock’s chart pattern that other, more orthodox followers of O’Neil-style, “CAN SLIM™” methods do not see as “buyable.” For the most part, standard base breakouts these days do not yield the same upside thrust that they used to, and examples like Facebook (FB) and Twitter (TWTR) over the past several weeks highlight the futility of buying such breakouts. The fact is that so far in this quantitative-easing, or “QE,” environment of 2015 the best moves in individual stocks have come from these Ugly Duckling buy set-ups.
$LCI Example
A case in point is drug-maker Lannett Company (LCI), shown in Chart 1, which broke out from a “cup” base in mid-February and had a short move higher from there that extended into late March and early April. By late April, however the stock had dropped back below its February breakout buy point in a classic failure. This sort of action can be frustrating for investors who buy the breakout and then hold onto the stock in anticipation of a potentially longer and more sustained uptrend, only to see all their gains eventually dissolve to nothing.
But setting aside the old rules and incorporating an Ugly Duckling approach with LCI would have worked quite well, producing sizable gains before the stock ever broke out of its cup base and into new high price ground. LCI had started a fairly steep price correction in early November 2014 and continued moving lower until early January 2015. It was at this point that the stock began to find its feet, so to speak, and begin attempting to “round out” the lows of a potential new base formation. Positive confirmation of this rounding out process was found in a very subtle pocket pivot buy signal in mid-January that was followed by another pocket pivot that occurred on a big-volume gap-up move four days later. A pocket pivot is a buy point within a stocks’ chart base or consolidation that occurs when the stock moves up through or off of the 10-day or 50-day moving averages (sometimes this can also occur at the 20-day or 200-day moving averages) on volume that is higher than any down-volume day in the pattern over the prior ten trading days. A detailed discussion of the pocket pivot concept can be found in the book Trade Like an O’Neil Disciple: How We Made 18,000% in the Stock Market (John Wiley & Sons, 2010.
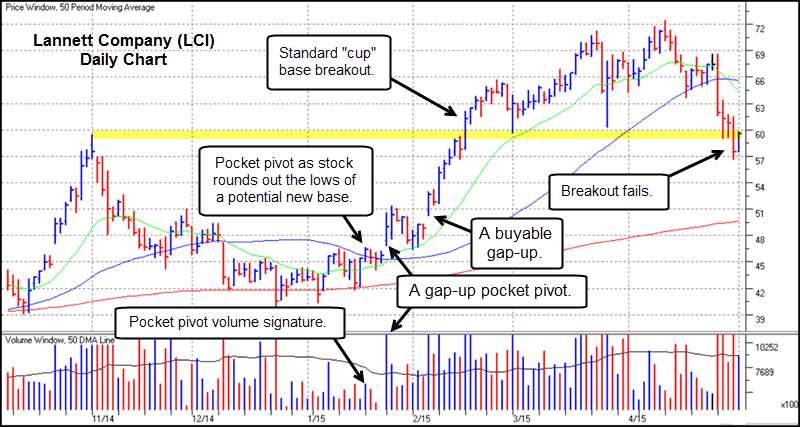
Chart 1 – Lannett Company (LCI) daily chart, 2014-2015. Chart courtesy of HGS Investment Software, LLC, ©2015, used by permission.
Following these two pocket pivots LCI then had a “buyable gap-up” move, a type of buy point we use where the intraday low of the gap-up day’s price range serves as a reference for a downside stop. In this case, the buyable gap-up worked beautifully, sending the stock straight up to new highs over the next seven trading days. At this point, anyone who acted on the basis of our proprietary buy signals near the lows of the base, when it was looking very much like an ugly duckling, watched it transform into a beautiful swan as it broke out to all-time price highs. Of course, by the time the breakout had occurred, Ugly Duckling buyers were way ahead of the game. Meanwhile, anyone who bought the new-high base breakout was eventually left high and dry.
$CYBR Example
Another recent, concrete example of the Ugly Duckling phenomenon can be found in CyberArk Software (CYBR), shown in Chart 2, which has been a hot name in the highly compelling cyber-security software group. Despite being a hot stock, CYBR’s movements have been wide and volatile, a fact that has made handling the stock very difficult for orthodox base breakout buyers. For example, we can see a gap-up base breakout on the chart that occurred in November of 2014. That breakout eventually went nowhere as the stock drifted back into its prior post-IPO consolidation price range in late January 2015. This might have pushed breakout buyers in CYBR out of the stock, but a few days later the stock issued a pocket pivot buy point coming up through the 50-day moving average, and it was again off to the races.
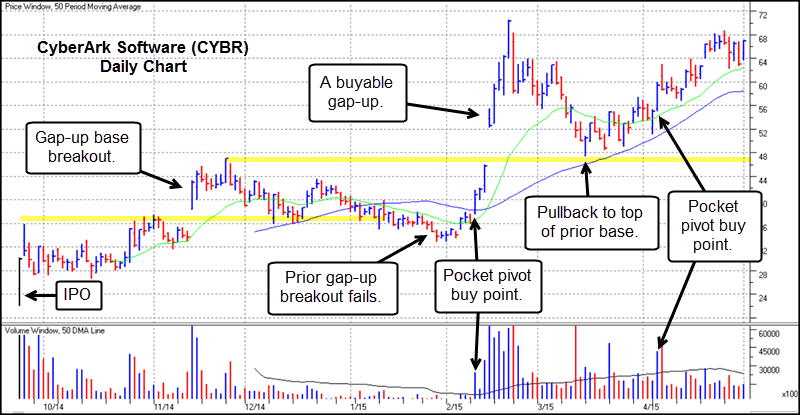
Chart 2 – CyberArk Software (CYBR) daily chart, 2014-2015. Chart courtesy of HGS Investment Software, LLC, ©2015, used by permission.
After the early February pocket pivot CYBR then gapped up after reporting positive earnings on February 12th in a move that we classify as a “buyable gap-up” or “BGU.” A BGU can in fact be bought using the intraday low of the gap-up day as a downside selling guide or stop, and in this case CYBR never moved below the intraday low of the February 13th gap-up. Orthodox O’Neil-style investors would have shunned this gap-up as being too “extended” from the breakout point. But if one bought or added to CYBR (hopefully first bought on the early February pocket pivot) on that BGU, the stock streaked to an eventual high of 70.48 in four days. That represented a 73.2% move from the 40.90 close of the initial pocket pivot in early February.
A prudent investor likely would have sold at least part or all of their position into this extreme, semi-climactic type of move. This would have been a smart move as the stock then slid right back into the top of its prior base, erasing all of those gains over the next three weeks. But again, the Ugly Duckling reared its head as the stock found support along its 50-day moving average in late March. It then flashed another pocket pivot in early April that pushed the stock up and off of the 20-day moving average. As of the time of this writing in early May, CYBR appears poised to break out again, but resourceful Ugly Duckling-style investors would already be in the stock below the 60 price level. This would put them well ahead of any impending breakout, should that occur. CYBR is expected to announce earnings on May 7th, so readers should follow-up on the stock to see how it eventually plays out from where it is in Chart 2.
Outlook
In the Age of QE, it is my belief that the rules for investors have evolved somewhat, and only those who are able to think outside the box are likely to have a better chance at achieving strong performance in the otherwise choppy market we’ve seen so far in 2015. The basic reality, in my view, is that the post-World War Two environment of secular economic growth has ended, and a new era has taken hold. Investors should remember that even the great trader Jesse Livermore, described in the investment classic, Reminiscences of a Stock Operator, by Edwin Lefevre (John Wiley & Sons, 2010), ran into difficulties applying the methods that worked for him so well in the early 1900’s when the post-depression market environment of the mid-1900’s came about.
While I still believe that the essential, foundational investment principles as espoused by the likes of Livermore, Richard Wyckoff, and William J. O’Neil continue to hold true, the precise mechanics of investing in real-time have changed. Careful study of how the stock market truly works in the Age of QE reveals these mechanics, which can be described in very concrete terms as I have done in this article. Thus in my mind it becomes more a matter of “adapt or die.” If one suffers from clinical depression, as Jesse Livermore did, then perhaps suicide was his only choice. I, on the other hand, choose to take a more optimistic view that embraces the ability of human beings to learn and adapt if they are able and willing to use their minds, something that they have done for millennia in the quest for survival. Therefore, when it comes to investment survival, developing an understanding of how Ugly Duckling buy set-ups work can provide investors with a useful mode of adaptation.
###
Gil Morales is a proprietary trader and the CEO of Gil Morales & Company, LLC, a registered investment advisory firm, as well as the author of the Gilmo Report (www.gilmoreport.com). He is also a principal and managing director of MoKa Investors LLC and Virtue of Selfish Investing, LLC, as well as a co-author and co-founder with his colleague, Dr. Chris Kacher, of www.selfishinvesting.com.
For more articles from Gil Morales:

