

Last Friday
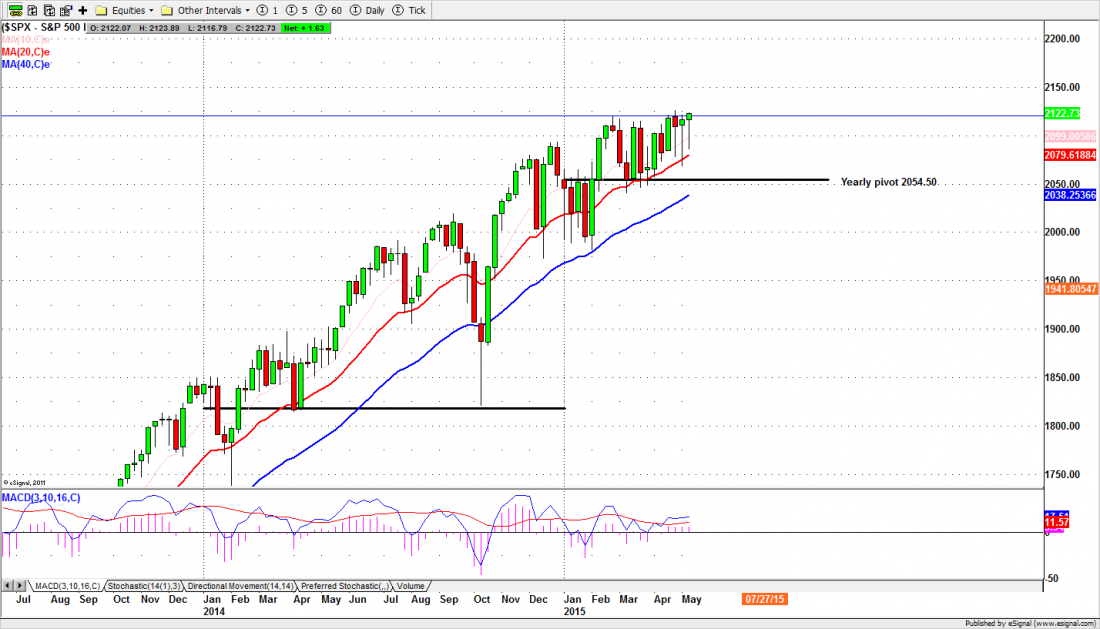
The S&P 500 cash index ($SPX) closed at 2122.73 last Friday — an all-time high close — up 6.63 points for net weekly gain of 0.3%. And yet, it doesn’t quite feel as good as it should. Sure, it is a new high on a closing basis. But we can’t help feeling suspicious.
The SPX started the week with heavy losses, down 33 points on the first two days, but the selling ended on Wednesday, when the retail sales numbers came in below (!) expectations. This is purely an attempt to finesse the Fed. The hope is that bad numbers – and last week the numbers were mostly bad – will persuade the Fed to delay or drop the interest rate hike initially expected for June, but now receding into the distant future.
This has nothing to do with the real economy and everything to do with moving the market around for fun and profit, especially during the monthly option expiration week. In fact front-running the Fed is the new normal for trader, an essential skill – maybe the only skill — that determines success or failure.
Today
The S&P 500 index (SPX) returned to the April high area for closing Friday. This indicates that the big cap stocks are now leading the market higher and confirms that the bull uptrend is continuing – at least to the extent that the charts are still valid.
This week traders are watching to see if the index will give final confirmation that it is breaking out of the extended wedge pattern (a flat top with higher lows) by making new highs above the April high. The FOMC minutes this week could the catalyst, but the Fed Chair is speaking on Friday, and she may cool the market for a while.
We want to see the breakout confirmed by the index by closing above the 2125 level. The 2147.83-2136.50 area is likely to be the first profit taking zone, and any price advance may stall there for a time.
But if the broad market rallies strongly, the rally could continue into June. The full measurement of the target for a breakout from the wedge pattern is in the 2196-2200 zone.
The yearly pivot around 2055-45 is the key. As long as short-term pullback doesn’t break below that level, the final destination for this Bull market should be in the 2485 area, a long-term target which we are not likely to reach this year.
For the short term, we have the VIX options expiring on Tuesday. The volatility index expiration usually results in larger-than-normal price swings. The index itself ($VIX) reached 12.38 last week, and when the index is that low we often see the market sell off. So Monday may be a down day; we’ll be watching the volume for the first clue.
S&P 500 Mini futures
The S&P500 mini-futures (ESM5) made a new all-time high in the small hours of the morning Friday, but dropped off steadily until the option traders went to work mid-afternoon. It made a narrow range day on lower volume, and closed less than two points above the previous close.
Today ES could repeat last Friday’s range first and later make a breakout move. A move below 2112.50 could push the ES down toward 2106-03.75 zone for testing. A move above 2125 will be bullish. It could trigger an upside run toward 2132.25-35.50 or higher.
Today (Monday) we have Fed member Charles Evans speaking, and the release of the housing market index. Both are capable of moving the market.
The major support levels for Monday: 2103-06.50, 2093-90.50, 2085-88, 2070.50-75.50:
the major resistance levels: 2121.50-24.50
S&P500 Weekly chart, May 15, 2015
###
To receive free market insights with actionable strategies from naturus.com, click here

