

There are hundreds of ways to determine the current state of the S&P 500 (SPX). Most traders/investors use methods that are only based off of the price of the SPX. Some common tools used are the stochastics-RSI-MACD-price oscillator and CCI.
These are great tools and I use them myself. But as I said above, they are all based off of the “price” of the SPX. Is there another way that has proven to be more affective in predicting SPX reversals BEFORE they hit? Yes, combine how traders “feel” (sentiment) about the market with traditional technical analysis.
My trading process
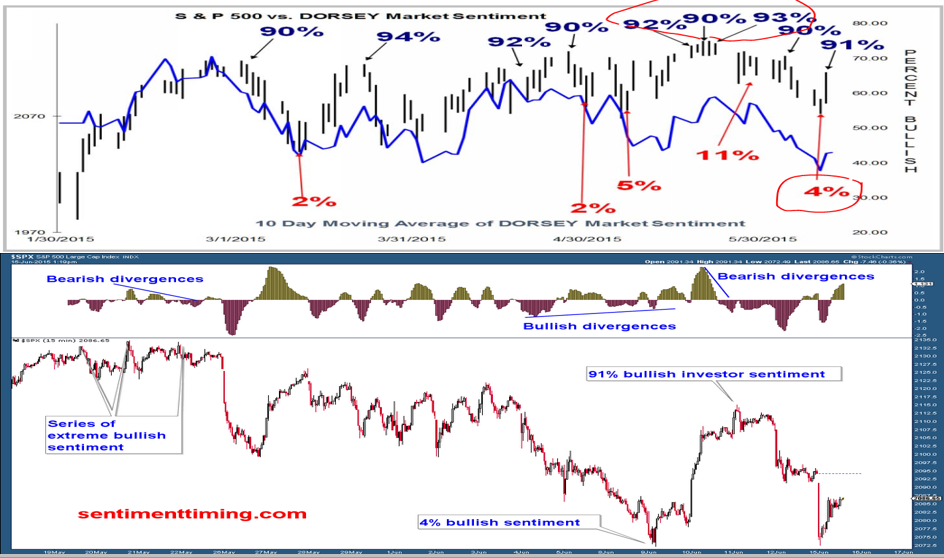
The first thing I do is take note where investor sentiment is each week. There are a number of sites that provide investor sentiment, but I use Woody Dorsey’s sentiment timing numbers-as they have always worked best. If investor sentiment is very bullish, I will look for a short side trade. If it is very bearish, I will look for a long trade. Extreme bullish or bearish sentiment has been one of the best leading indicators I have used.
Once sentiment is at an extreme, I look at the traditional Technical’s, to see if there are any divergences in play. When there are bullish or bearish divergences (price makes higher highs as technical indicator makes higher lows is a bearish divergence-vice versa for bullish divergence) If there are divergences in place, I then want to look at WHERE price may reverse.
When determining “where” price will reverse, one can try and front run the imminent reversal by using pivots-Fibonacci levels/extensions or support resistance levels. But often I use a price break to make a trade. Meaning I am not trying to catch the exact top or bottom. I wait for price to confirm the move before making the trade.
I have done very well using this process and so can you. Knowing where sentiment is will help you the most. It shows you what direction you should be looking for your next trade.
Want to know where investor sentiment is now? Get your Free Sentiment Timing Index Chart here

