

The Nasdaq has been in “gap-hunt mode” for more than a month. These periods arise when there is a sufficient number of bears to create multi-day down moves.
Due to the selling over the last few days, the Volume Profile Point of Control (VPPOC) has moved down almost 100 points since last Thursday. This will be the target for any bounce from these lower levels.
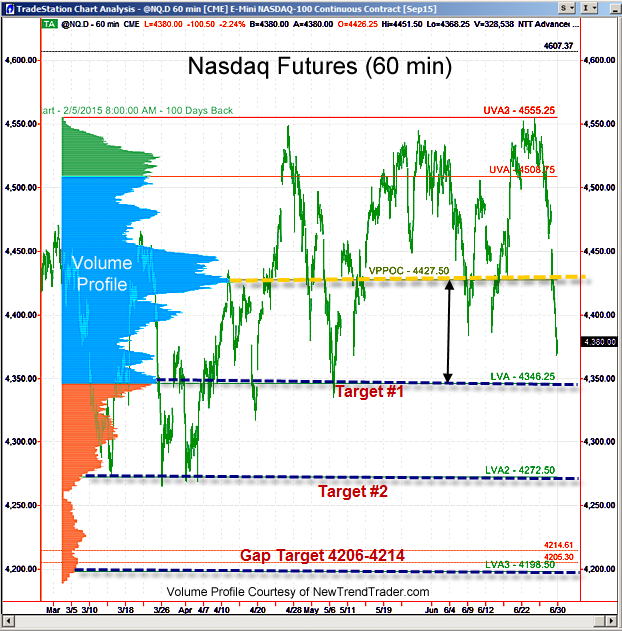
The Upper and Lower Value Area lines (UVA and LVA respectively) represent the one standard deviation point in the volume distribution measured from the VPPOC. The LVA is currently at 4346 and it is the next downside target for this 100-day look-back profile.
The LVA 2 and LVA 3 levels represent even lower targets. Unfortunately for the bulls, LVA 3 is very likely to be attained since there is an unfilled gap between 4206 and 4214.
A Note on Volume Profile
The histogram on the left side of the chart shows the volume distribution in the Nasdaq futures for different periods of time. Key support and resistance levels are indicated by the peaks and troughs. If you would like to receive a primer on using Volume Profile, please click here

