It is no secret to investors that we are living in unprecedented times. At no time in history have so many governments around the globe engaged so actively in the printing of money to counteract and essentially monetize away the effects of the glut of debt that led to the 2008 global financial crisis. This wave of liquidity has in turn distorted markets in a way that has made navigating today’s stock market a frequently trying and frustrating affair for investors relying on static, “time-tested” methodologies. Yet the markets have continued higher since the Fed turned on the spigots of quantitative easing to “full blast” in early 2009. Nevertheless, many investors complain that the current market environment is “not normal,” and attribute its difficulty to the distortions of quantitative easing.
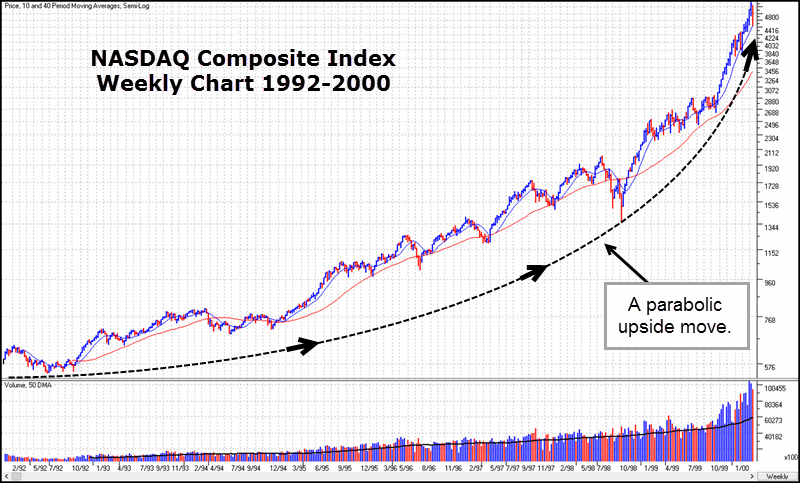
To some extent I think this is a fair assessment, but it also raises an important question in my mind. Namely, just what is a “normal” market, and has the market ever truly been “normal?” In many cases investors appear to assess a market’s “normalcy” in terms of how it compares to the type of market that they “grew up” in. For instance, those who began investing in the early 1990’s, like myself, got involved with the markets just as the train was leaving the station on what became a wonderful, decade-long parabolic move to the upside, as we can see in Chart 1, a weekly chart of the NASDAQ Composite Index covering that magical decade.

Chart 1 – NASDAQ Composite weekly chart, 1992-2000. Chart courtesy of HGS Investor Software, LLC, ©2015, used by permission.
Anyone who started investing in the 1990’s was likely conditioned to expect a market that trended steadily higher with increasing upside momentum all along the way. After the Crash of 1987, new investors were finding their way into the market, particularly among baby-boomers who were at that time reaching their prime saving and investing years, leading to a general trend of money flows into stocks, and the growth in the number of mutual funds during the 1990’s provides testament to this. Thus it was the investment inflows coming from baby-boomers who were salting away money for their retirement provided the fuel while a burgeoning technology-based economy centered upon the growth of personal computing and the internet provided the spark that in turn ignited the parabolic rocket ride that characterized the 1990’s. By the time the parabola reached its terminus in March of 2000, the NASDAQ had gone from a starting point of 415.80 on January 1, 1990 to a peak of 5132.50, a nearly thirteen-fold move! Was this a “normal” market?
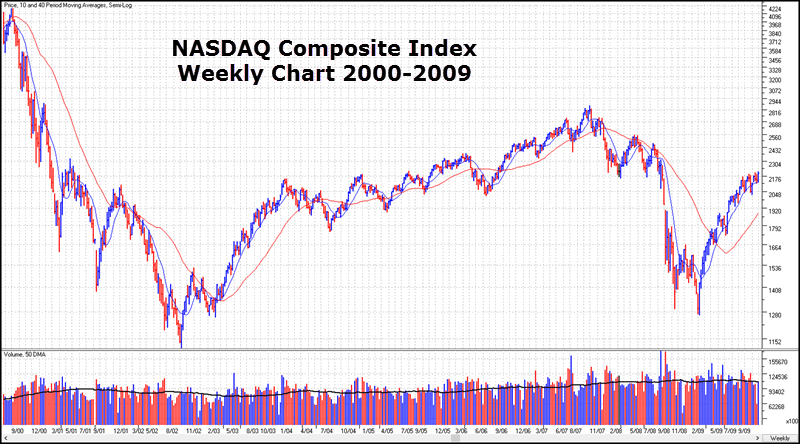
Those who missed the 1990’s and began investing in the year 2000 experienced a market that was considerably less “user-friendly,” as the weekly chart of the NASDAQ Composite Index from 2000-2009 in Chart 2, below, shows. Thus they became conditioned to an entirely different kind of market. The first decade of the New Millennium started out with a brutal bear market that did not bottom until late 2002 and which saw the NASDAQ dive a total of -78.4%. This was followed by a relatively steady uptrend into late 2007 with the NASAQ rising from a 2002 low of 1108.40 to its 2007 peak of 2861, and then another brutal bear market in 2008 through early 2009 where the NASDAQ decline -55.8%. Was this a “normal” market?

Chart 2 – NASDAQ Composite Index weekly chart, 2000-2009. Chart courtesy of HGS Investor Software, LLC, ©2015, used by permission.
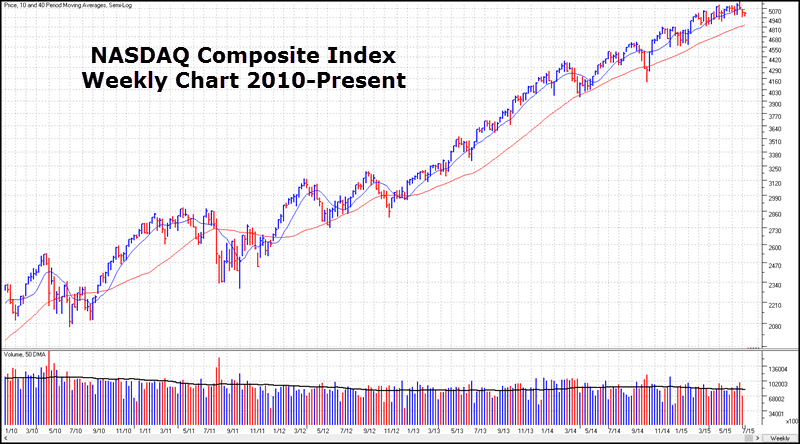
Once the Fed began printing money with unprecedented ferocity in early 2009, a steady uptrend developed where every market correction became little more than a buyable pullback, as we see in the weekly chart of the NASDAQ Composite from 2010 to the present in Chart 3, below. In this manner, investors who started out in 2010 have been conditioned towards a “buy the dip” mentality. While the uptrend began in somewhat volatile fashion in 2010 and 2011, including the famous “Flash Crash” of May 6, 2010, a very abnormal event, it has since smoothed out into something that one might conclude is more similar to the 1990’s. The major difference, however, is that the market during the 1990’s was driven by a steady inflow of investment dollars as baby-boomers entered the market and household ownership of equities began to expand significantly. The market of the second decade of the New Millennium has been driven by a steady diet of liquidity being fed to it by extreme “easy money” policy emanating from the Fed and other central banks around the globe. Again, we ask the question, is this a “normal” market environment?

Chart 3 – NASDAQ Composite Index weekly chart, 2010-Present. Chart courtesy of HGS Investor Software, LLC, used by permission.
The answer to all three questions is essentially this: There is no such thing as a “normal” market environment, period. Every market cycle is different, and is driven by different underlying conditions. Investors must be able to evaluate these conditions within the context of precisely what the market is showing them in terms of price/volume action and then adjusting their strategies and methodology as necessary. Otherwise they will find themselves sitting around waiting for the return of a “normal” market that never comes. Ultimately it is how investors utilize the market’s feedback that determines whether they can adjust properly and effectively, or whether the market simply leaves them befuddled as they look to blame an “abnormal” market environment for their failure.
In the year 2015 we have to consider that underlying conditions have changed when compared to the post-World War 2 secular growth period that ended, at least in my view, in 2000. Today, with baby-boomers in retirement mode and so-called “Millennials” distrustful of the financial markets, the demographics are tipping away from the prior trend of increasing household ownership of equities. What has replaced this is a market that is perhaps driven more by massive money-printing on a global scale than the usual demographically and economically-driven money flows into or out of stocks. At some point this will end, and investors will have to adjust to a new reality.
Perhaps the greatest task facing any investor lies in understanding what the market is going to give them at any point in time. Some market environments are generous, while others are begrudging and stingy. Therefore investors must constantly be evaluating what is available to them in terms of practical profit potential. As we move into a new era of where markets will likely be driven by new types of underlying money flows, this will become to primary problem to be solved by those who seek to profit in the stock market. Adapt, or die!
Gil Morales is a proprietary trader and the CEO of Gil Morales & Company, LLC, a registered investment advisory firm, as well as the author of the Gilmo Report (www.gilmoreport.com). He is also a principal and managing director of MoKa Investors LLC and Virtue of Selfish Investing, LLC, as well as a co-author and co-founder with his colleague, Dr. Chris Kacher, of www.selfishinvesting.com. He and Dr. Kacher are the co-authors of the best-selling books, “Trade like an O’Neil Disciple: How We Made 18,000% in the Stock Market” (John Wiley & Sons, August, 2010), “In the Trading Cockpit with the O’Neil Disciples,” (John Wiley and Sons, December 2012), and their newest book, “Short-Selling with the O’Neil Disciples: Turn to the Dark Side of Trading” (John Wiley & Sons, April 2015). He is a former internal portfolio manager for William O’Neil + Co., Inc., where he also served as Chief Market Strategist, Vice-President and Manager of the firm’s Institutional Services group from 1997-2005, and co-authored with William J. O’Neil a book on short-selling, “How to Make Money Selling Stocks Short” (John Wiley & Sons, 2004).


