

The Hybrid Lindsay forecast calling for a high in the Dow near Wednesday (July 15) of that week (A Low In The Dow: A Long Hot July) was successful even if a day early. Although both the S&P 500 and NASDAQ continued their advance until the following Monday, the Dow Industrials index printed its high on July 16. That week’s Commentary also mentioned the forecast for a low during the period July 24-31. Let’s see how that is developing.
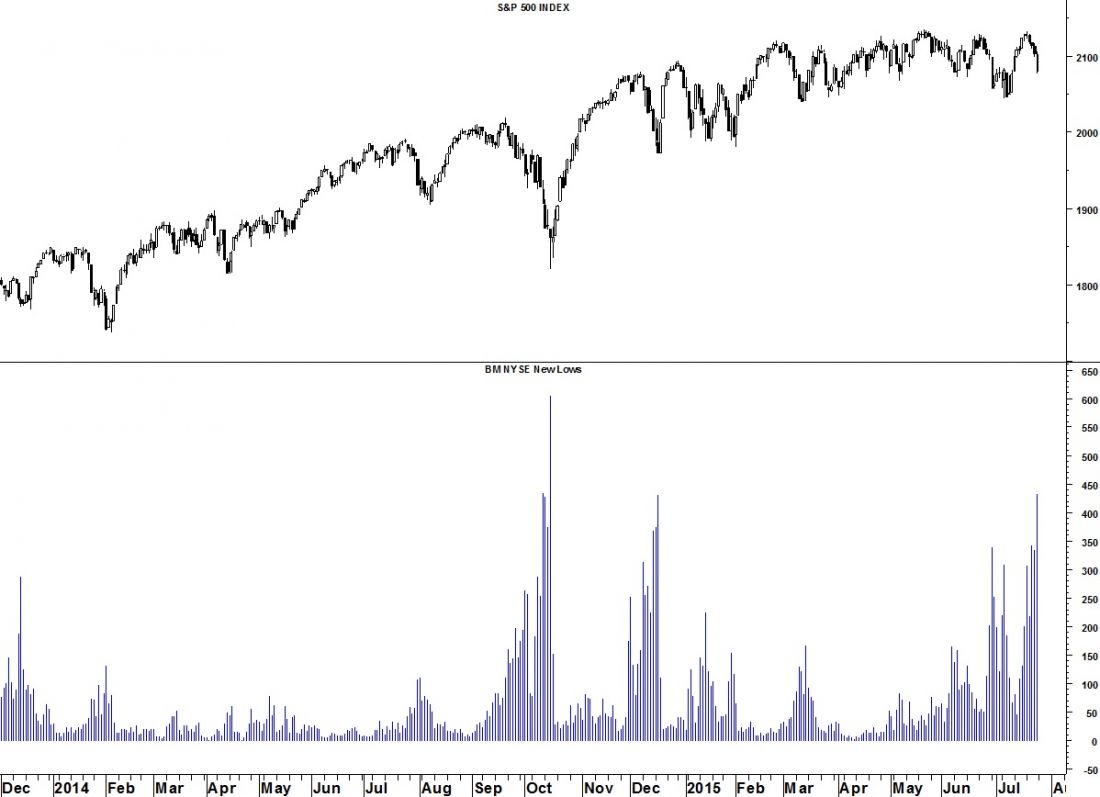
The Dow is down 3.04% since the July 16 high. Last week the Dow had its biggest decline since December. By last Friday, new NYSE 52-week lows (chart) had soared to their third highest level in over a year – a level which usually marks bottoms in the equity indices. In addition, the McClellan Oscillator closed the week at -133 and just above its lower Bollinger Band. A close below the band or -150 is often seen at lows in equities. A tradable low is very close and may have already been seen last Friday.
Obtain your copy of the July Lindsay Report at Seattle Technical Advisors.com.

