

By: James Cordier, Michael Gross
An outsider watching the prices of crude oil shift up or down may think this is some sort of random event.
“Who is causing this?” gas buyers and clueless politicians often demand, as though an evil oil company executive is sitting in a room throwing a lever to turn the supply on or off.
As an investor willing to do a little homework, however, you’ll find projecting price ranges for oil is a little less populist rhetoric and little more science and common sense.
Demand Cycles for Oil
Oil is one of the most cyclical markets there is. This alone takes some of the mystery out of projecting overall direction of prices.
Oil demand surges during summer months as excess gasoline demand from summer “driving season” forces refineries to ramp up production. This increases demand for crude oil.
This refinery cycle is illustrated in the Chart below:
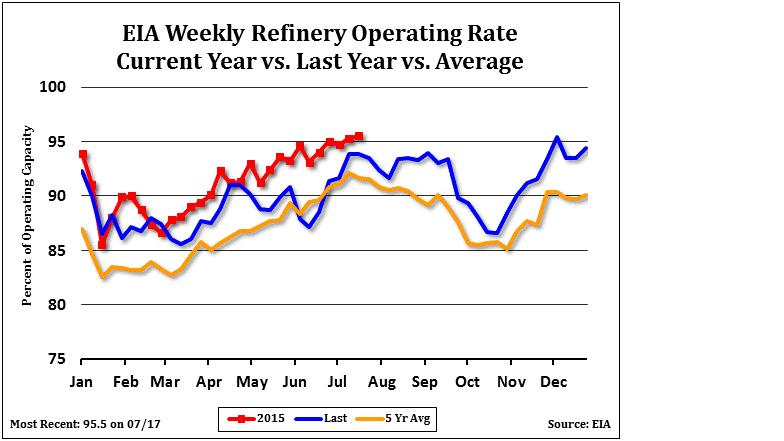
Refinery operating rates tend to peak in mid-summer and then gradually fall off as driving season ends in September. Demand for crude oil thus tends to follow this same pattern.
You will also notice that this pattern tends to repeat itself in the fall as refiners switch over production to heating oil and ramp up again into the early winter months.
These are only tendencies and only one factor that go into price discovery of oil. But an astute trader who is aware that demand for crude tends to be strongest in Spring and summer and weaker in the fall can be a step ahead of other traders who are attempting to predict price direction “blindly” while following only charts or news reports.
How to Gauge Supplies
Cyclical tendencies should not be viewed in a vacuum however. The absolute amount of supply plays a big role as well. (To see how supplies can sometimes trump seasonal tendencies, read our latest trading update “Game Changer in Crude Oil” now at www.OptionSellers.com/blog)
Fortunately, anyone can track weekly builds or draws in crude oil through a weekly report released by the Energy Information Association (EIA). The EIA tracks and reports weekly US inventories of crude oil.
Each week’s number is not so important in and of itself. But by following the trends in the reports (ie: are supplies rising or falling; how does this compare to past years) one can obtain a wealth of information about the oil market that tends to be hidden from public eye.
Example of weekly EIA report below:
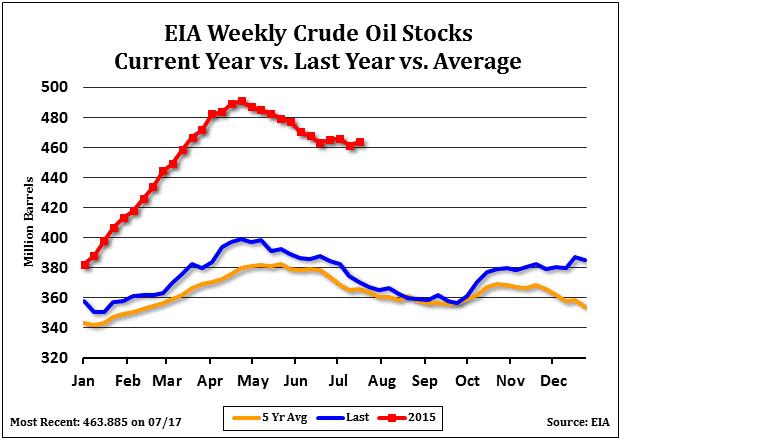
Weekly stock reports are not as important as the overall trend of builds or draws in stocks.
For instance, the chart above shows, while following a typical seasonal pattern, 2015 supplies are so far above “normal” levels for this time of year, that it casts a bearish pall over prices. This is true even during a time of year when demand tends to be peaking.
Traders used to watching the news may ask “But what about Iran? What about China? Don’t they affect oil prices?”
Yes, they do. But only in relation to how they affect (or are expected to affect) global supply and demand. The score is kept on charts like the ones above.
Knowing what they are at any given time of year can give you a considerable advantage over those unfamiliar with them.
You can learn more about how to apply this to selling options by watching the accompanying video (above.)
Part II of this lesson, “The Two Key Figures of the Agricultural Markets” will be featured in the upcoming Option Seller Newsletter.
If you are a high net worth investor interested in selling options in crude oil and other commodities, you can learn all about it in a Free Guide now made available to you entitled The Option Selling Solution. Request your copy now at www.OptionSellers.com/Booklet. There is no obligation, your privacy is strictly respected and no phone number is required.
James Cordier is the author of McGraw-Hills The Complete Guide to Option Selling, 1st, 2nd and 3rd Editions. He is also founder and president of OptionSellers.com, an investment firm specializing in writing commodities options for high net-worth investors. James’ market comments are published by several international financial publications and news services including The Wall Street Journal, Reuters World News, Forbes, Bloomberg Television, Fox News and CNBC. Michael Gross is director of research at OptionSellers.com. His published works have appeared on MarketWatch.com, Yahoo Finance, Forbes.com, Businessweek.com and has been featured by Morningstar Advisors. Mr. Cordier’s and Mr. Gross’s book, The Complete Guide to Option Selling 3rd Edition (McGraw-Hill 2014) is available at bookstores and online retailers now.
OptionSellers.com
- Price Chart Courtesy of CQG, Inc.
- Fundamental Charts courtesy of The Hightower Report
- Seasonal Chart courtesy of Moore Research, Inc
***The information in this article has been carefully compiled from sources believed to be reliable, but it’s accuracy is not guaranteed. Use it at your own risk. There is risk of loss in all trading. Past performance is not necessarily indicative of future results. Traders should read The Option Disclosure Statement before trading options and should understand the risks in option trading, including the fact that any time an option is sold, there is an unlimited risk of loss, and when an option is purchased, the entire premium is at risk. In addition, any time an option is purchased or sold, transaction costs including brokerage and exchange fees are at risk. No representation is made that any account is likely to achieve profits or losses similar to those shown, or in any amount. An account may experience different results depending on factors such as timing of trades and account size. Before trading, one should be aware that with the potential for profits, there is also potential for losses, which may be very large. All opinions expressed are current opinions and are subject to change without notice.

