

We began discussing the growing imbalance in the gold market here, two weeks ago in, “ Gold Alert: Big Spec Short Position Seen.” The expectation in a situation like this is for a sharp market reversal higher. This would punish the newly short small speculators and prove the commercial traders correct in their assumption that gold has fallen below its fair value on the open market. Clearly, the Chinese selling of a reported 33 metric tons of gold worth approximately $1.3 Billion Dollars threw a wrench in our short-term assessment of pricing action. However, analyzing the market’s action through the Commitment of Traders Report shows that this imbalance has continued to grow which is making the market internals ever more bullish and prone to the setup we’ve been waiting for.
We base our initial trading screen on the idea of putting ourselves on the same side of the market as the commercial traders. There are two important reasons for this. First of all, it is our belief that the companies pulling commodities out of the ground or, boxing them up for consumer delivery know their market better than we do. Secondly, I’m a swing trader and the rise and fall of the markets can clearly be seen as commercial traders come in and sell rallies when the market is above their value area and buy the market when the market falls below their value area. This is a mean reversion trading methodology that attempts to capture the market’s return to fair value. We plotted this action in the gold market from both the commercial and small speculator sides in our piece here, two weeks ago.
This week, we’ll look at the Disaggregated Commitment of Traders Report and review the action among the market’s main trader categories. We used green boxes represent bullish behavior in the market while the lone red box denotes bearish action. There are five categories in the included report.
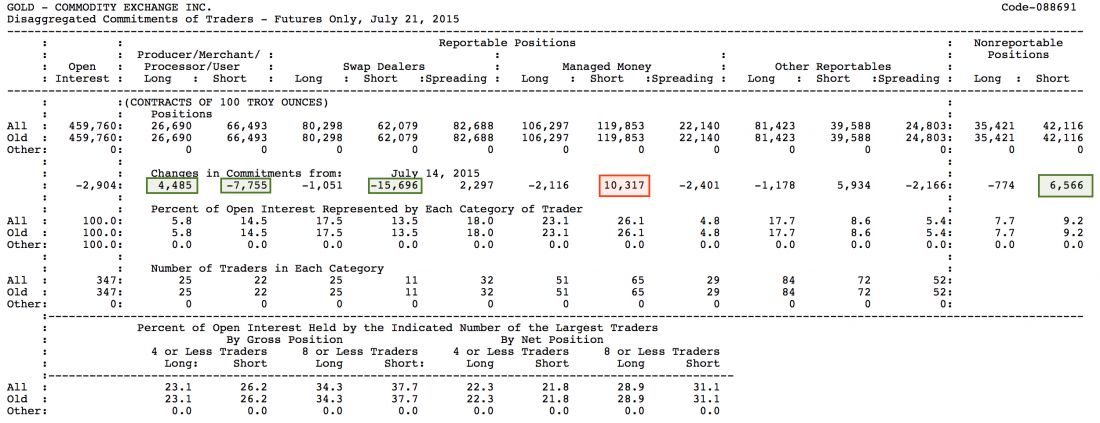
The Producer/Merchant/Processor/User category, which we refer to in our work simply as, “Commercial Traders,” is the main group we follow. Over the last week, traders in this category increased their long position by 4,485 contracts and decreased their short position by 7,755. It goes to reason that their net position is now more bullish by 12,240 contracts. This has brought the commercial net position to its most bullish level since July of 2013. Furthermore, the next reference point dates all the way back to January of 2002. Commercial traders clearly feel $1,100 gold is value priced.
Swap Dealers represent the exchange for physicals market. The decline in their short position by more than 15,000 contracts indicates the re-purchase of short hedges in the swaps market. Less physical gold is being sold at these levels. Therefore, the swaps dealers aren’t taking in physical gold to hedge in the futures. Physical gold selling on the open market is drying up near $1,100 per oz.
Managed Money is exactly what it sounds like, CTA’s RIA’s etc. These are typically trend traders. Gold’s move to new lows last week extended the trend and brought more selling with it to the tune of 10,317 new short positions.
Nonreportable Positions represent the small speculators. They’re usually wrong, especially at the extremes, which, also makes them a good group to follow although their actions are too erratic to use as a lone indicator. Their bearishness grew by more than 7,000 contracts last week.
Putting it together shows increased commercial trader buying, declining swaps action and continued selling on new lows by managed money and small speculators. Considering open interest declined in four out of the last five sessions, and more than 4% for the week, we still feel that this market is ripe for a reversal. Keep the losses small and don’t be surprised to be right once this market heads back towards $1,150 per oz.

