

The Kiwi is probably the worst performing currency this year, having lost more than -15% on a year-to-date basis (the Canadian Dollar is the second worst performing currency, just to quench your curiosity) but it seems like there could be a lot more of meat left on the table, going by the analysis on NZD crosses.
The RBNZ has been on a rate cutting spree since June 2015 after interest rates were steadily hiked from early 2014 to 3.5%. The RBNZ delivered two 25bps rate cuts since its June 2015 meeting and remains dovish. The Kiwi understandably gained in the periods of up to 2014 and peaked at 0.88 before starting its decline. The currency has been oversold, that the most recent rate cuts from the RBNZ saw the Kiwi bounce, indicating how heavily the markets were positioned to the short side.
It might seem that the worst could be over for the Kiwi but the charts paint a different story, one that could see the Kiwi further depreciate in the coming months and quarters.
EURNZD – Renko Chart Analysis
We start our analysis by looking at the EURNZD 500 Pip Renko chart to understand the bigger picture. In the first chart below, the first thing that catches our eye is the break out from the falling wedge/triangle with 1.60 being the key break out level which was preceded by a bullish RSI divergence which failed to confirm the lows, resulting in a rally to clear 1.60 from the bottom end of 1.40. If the current break out is indeed valid, then we could see the minimum price objective of a rally to 2.3 take place in the medium – long term. Of course, there are quite a few technical levels that need to be cleared along the way, marked on the chart with the highlighted rectangles.
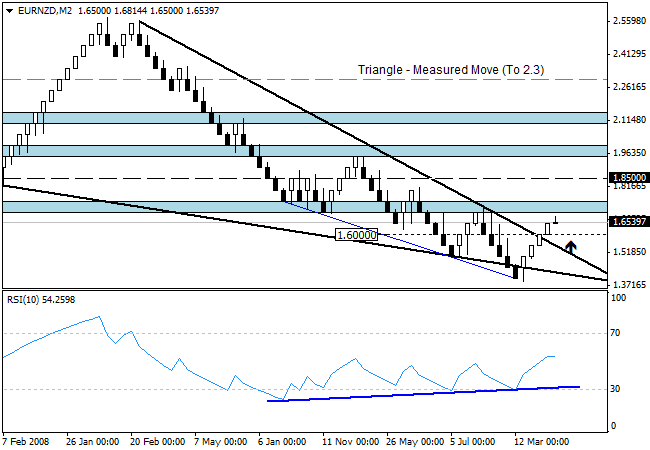
Figure 1: EURNZD, 500 Pip Renko Chart, Triangle Break out
Of immediate interest however is the retest to the break out to 1.60, which if successful could see a minimum target towards 1.75.
Looking to the 250 Pip Renko chart, it is evident that the break of the trend line came about with the bearish RSI divergence, which failed to confirm the highs. With the trend line broken, price briefly attempted to retest the previous highs at 1.68 but failed thrice at this level of resistance. To the downside, immediate support comes in at 1.64, which may or may not support prices. Therefore, on a confirmed break below this support of 1.64 opens the way for a clear test to 1.60. Applying the RSI, the bearish divergence further gives a downside target to 1.52, which could be one of the levels to look to, for a reversal to target the 1.75 region from the 500 pip chart.
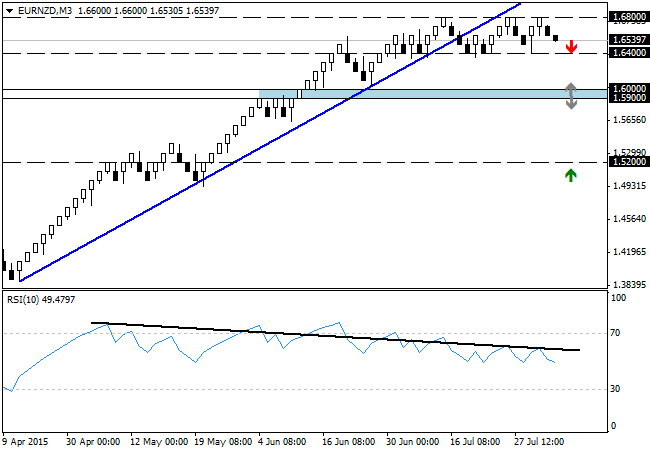
Figure 2: EURNZD – 250 Pip Renko Chart, RSI Bearish Divergence
To conclude, the EURNZD has been rallying strongly this year but a meaningful correction is about due and this correction could potentially mark the start of a new long term rally in EURNZD. The level to watch for is a retest 1.60 with expectations of prices to stay supported above or near the 1.50 price zone, failing which could invalidate this analysis. Alternatively, should prices continue to rally, we can expect to see some decline from 1.75 region, but a break above this price zone and to aim for higher price, EURNZD will have to form a strong support at or near the 1.75 handle.
A similar view has been established on the AUDNZD currency pair as well which is expected to see a small correction before the Kiwi is expected to weaken against the Aussie dollar. You can read more about the AUDNZD analysis by watching this video. CLICK HERE

