

The past two weeks have seen a remarkable recovery in the S&P500 large-cap index (SPX). The market has gained about 135 points from the September low, about half of that last week. (The SPX) closed at 2014.89 last Friday, up 63.53 points for a net weekly gain of 3.25%).
The primary cause was Fed action – more accurately, inaction. The Street now believes the Fed will continue to talk, talk, talk – there are three Fed officials speaking today, probably with three different opinions – but will not raise rates this year, and perhaps not next year either. With fears of a rate increase removed, the market felt free to jump.
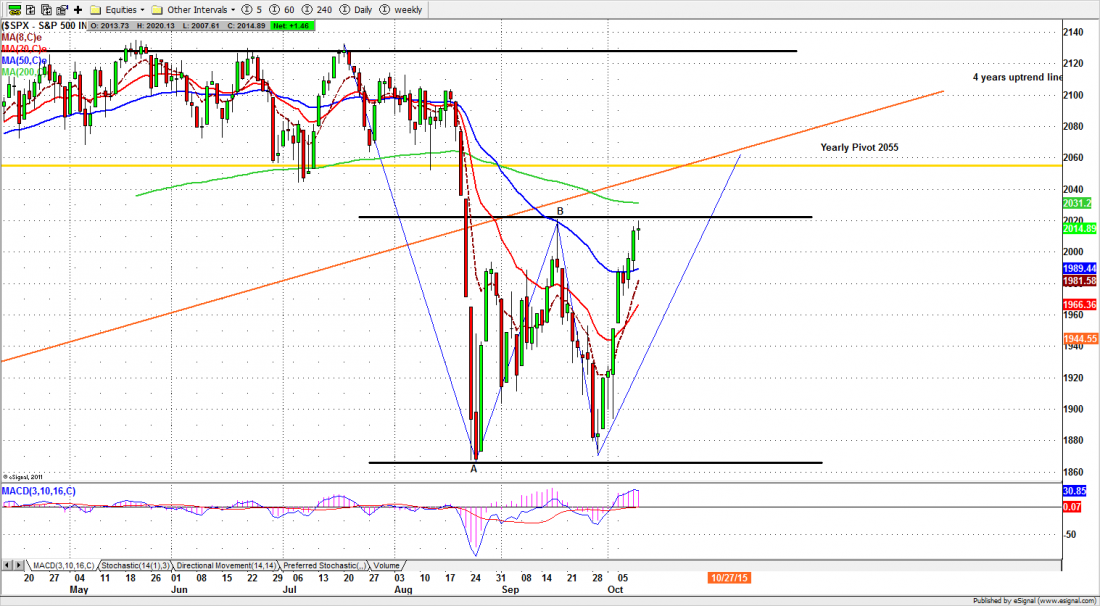
This sharp V-shape recovery in the SPX has become a familiar outcome after almost every significant decline since 2008 and is typically followed by a move higher. Will it happen this time too? We will probably find out this week.
First, remember that the SPX is still in a long-term uptrend, and down only 2% for the year. It is trading above the six-year trend line and as long as that support holds the major trend is still up.
For the intermediate term the picture is a little different. The index last week gained back half of the loss suffered in the big August crash, and has regained almost 61% of the move from the high in the first week of May to the low made Aug. 24.
It is close to the Fibonacci retracement. But it has been there before, on Sept. 17, and the market recoiled sharply from that resistance, moving down almost to the August low. Now it is making a second attempt, and has stopped at almost exactly the same place, around 2020. It may be establishing a trading range, and we are currently near the top.
This week or next we’ll find out if it can push through to higher ground.
What we expect
We think a small pullback is possible, but not certain. The 2040 level has been a significant resistance level and has held the price down in the past. Normally we would expect that resistance to hold until the end of the year. Now we’re not so sure.
The price action in the past two weeks has been very bullish. We may see a small pullback, but it is far too early to say that the bounce is done. And the price movement this week may be disrupted by outside events.
There are two index option expirations this week, on Thursday and Friday. The Fed is busy walking back the hyper-dovish comments in the FOMC minutes that goosed the market last week. And there is a raft of significant economic data being released.
The short-term indicators are getting overbought, but not extremely so. And market sentiment is turning bullish. There are a lot of contradictory indicators in play.
We think that as long as the Fed continues its yes-no ambivalence about the economic outlook and the prospects of a rate hike, there may be a small pullback but overall the rally is likely to continue – a lukewarm conclusion but about the best available on the evidence we have now.
But one thing seems reasonably clear: we could have some nauseating price swings before things settle down.
Today
The S&P500 mini futures (ES) have been up for nine days and closed Friday above the 50-day moving average. But the ES is looking a little tired after all that effort. Today is Columbus Day, when the markets are open but the banks are closed. (It is also Thanksgiving in Canada). Expect light volume, and either a smaller daily range or a repeat of Friday’s range.
2014.50-16.50 will be early session resistance and 1997-93.75 will be support. As long as ES doesn’t go outside the 2016.50 to 1992.75 range, buying at the low end of the range and selling at the high end will be the preferred strategy for the day.
Major support levels for Monday: 1950-45.50, 1905-03, 1875-50.50;
major resistance levels: 2015-18.50, 2029-28.50. 2035.50-37.50, 2050-46.75
For more detailed market analysis from Naturus.com, free of charge, follow this link
http://www.naturus.com/mailing-list-signup-page/

