I published an article in Trader Planet on 11/20 forecasting a breakout to new all-time highs for the S&P 500 before year end. I was imagining we might get that move started by the end of November, but so far it’s been 10 days of consolidation instead.
Perhaps the market is waiting for more bad news; some sort of disappointment that would catalyze a short sell off. That’s how many ‘surprise’ rallies begin and it’s the surprise rallies that tend to be the strongest.
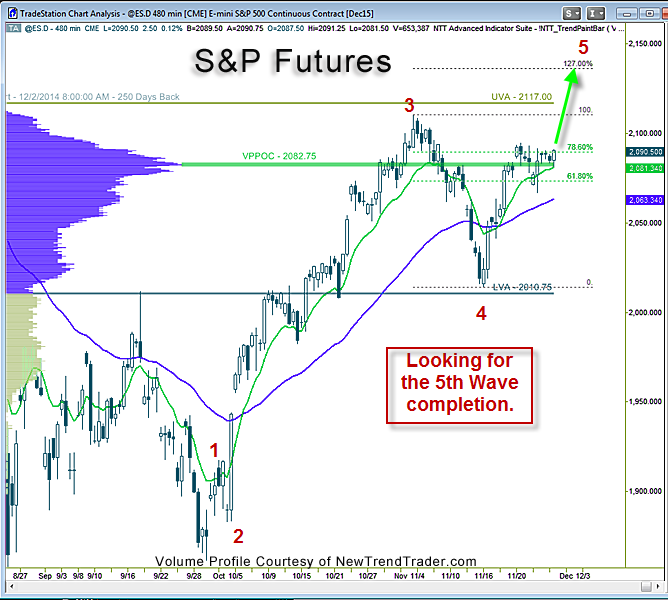
Meanwhile, the S&P is coiling around its Volume Profile Point of Control, 2082 on this chart. This is the high volume shelf that was violated a few weeks ago and caused almost a 100-point drop. The remounting of this level is a technical victory of no small magnitude for the bulls.
Additionally, investor sentiment is still cautious. According to AAII, Bulls inched up 2% to 32% and Bears dropped 2% to 28%. This is an acceptable level of bullish sentiment for a surprise rally as it shows a decent amount of skepticism in the rank and file.
A simple Elliott-wave analysis of the 480 minute chart shows a clear 5-wave pattern that I expect to resolve normally, i.e. with a new high completing Wave 5 at some sort of Fibonacci extension. There’s really no way to tell how far that wave might run, but most make it to the 127% level.
As the Fed’s mid-December rate hike is already priced in, perhaps early retail sales numbers will disappoint. Keep your fingers crossed; I really want to see Santa.
www.daytradingpsychology.com (Peak performance coaching for private traders)
www.trader-analytics.com (Services for traders at RIAs, banks and hedge funds)