

Mario Draghi and the ECB’s interest rate decision ripped through all the financial markets late last week. Volatility got a major lift as the stock market sank, the Dollar tumbled and money poured out of domestic interest rates. Unsurprisingly, in the recent pattern of the markets in general, they snapped right back. Some of the snap back surprised us but, not on the short end of the yield curve. Commercial traders have been buying the short end of the yield curve while selling the long end. Even in the current uncertain interest rate environment, commercial traders have made their expectations clear- betting on a steepening yield curve in 2016.
The domestic economy is muddling along and the numbers the Fed is watching have been consistently pointing towards the targets they’ve set to begin raising rates. There is quite a bit of speculation they may begin tightening as soon as the conclusion of the two day meeting ending on December 16th. Our personal thoughts have suggested through this fall that the March of 2016 meeting may be the first time we see them make a move. The Fed wants to begin hiking rates for two reasons. First, interest rates have been artificially low for too long. Secondly, raising rates is the Fed equivalent of reloading. This strengthens their primary economic tool. Market action this week has actually afforded the Fed some wiggle room because the yield curve has steepened without them taking any direct action. A steepening yield curve is typically a sign of a strengthening economy.
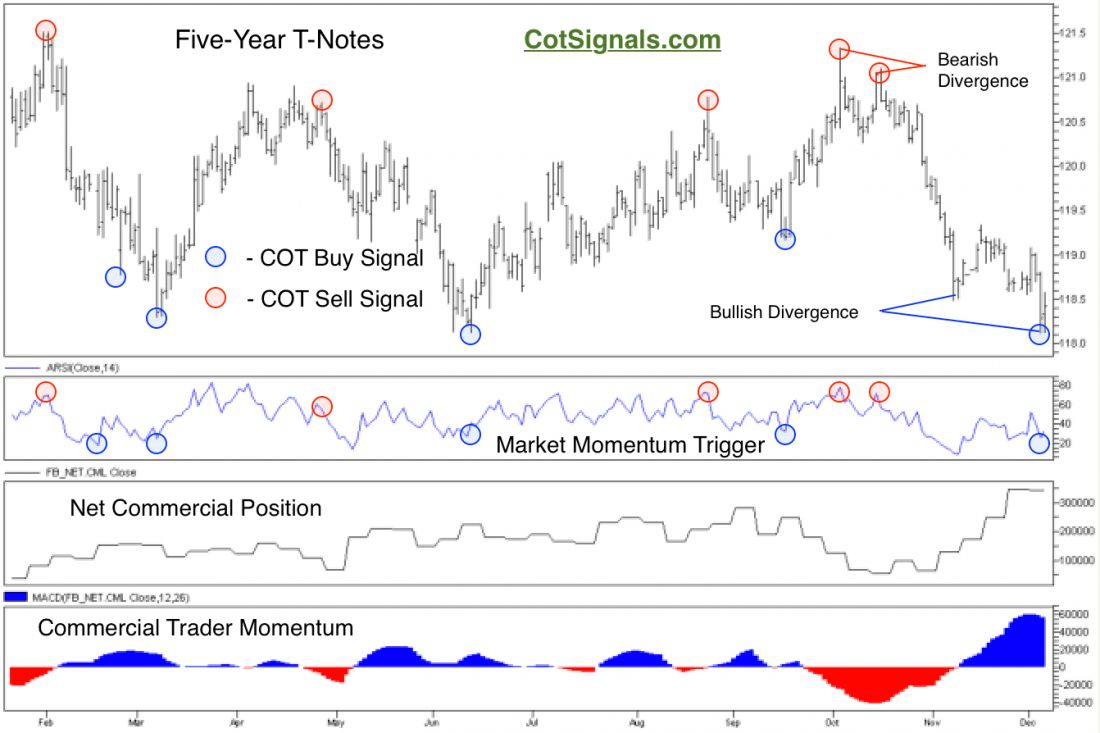
This brings us to the current trade setup. Commercial traders have purchased approximately 280,000 contracts in the last five weeks. This brings their net long position to more than 340,000 total contracts. This is an important number. Commercial traders reached a net long total of 387,000 contracts in March of 2014 but, before that, they hadn’t been this bullish on the short end of the yield curve since August of 2005. Therefore, while the Five-year Treasury Note slid last week, commercial trader support kept this market from falling through the June lows. When this is combined with the market’s snap back, the market has created a bullish divergence pattern as labeled on the chart below. We’ve also noted a recent bearish divergence to show that this method works well in technically traded markets like the interest rates on both the long and short side.
We’re looking to buy the Five-Year Treasury Notes, given the opportunity. We believe that commercial traders will continue to support this market through this month and perhaps, all the way into the March Federal Reserve Board meeting. Given the range bound nature of this market, we think a breakout above the highs at 119^12 could push the rally another full point. If the commercial traders are right, we’ll have a chance to re-evaluate their actions on the market’s rally. That will let us know just how serious they are about their current stance on the interest rate picture.
For Actionable Trade Strategies, Learn more at Cotsignals.com

