Front month natural gas futures traded all the way down to $1.802 in mid-December. Obviously, the energy sector has taken a pummeling over this past year and the market’s recent rally has sparked some new interest. However, based on the outline and chart below, we believe this is a short selling opportunity rather than the early legs of a new bull market.
First of all, some things to consider. The recent low of 1.802 doesn’t even rank in the top 12 yearly lows. In fact, the all-time low for the March contracts that we’re following is all the way down at $1.045 set in 1992. That’s an apples to apples seasonal comparison. Secondly, the commercial trader position is still overly long given their historical behavior. In fact, commercial traders set a new, net long record last June at just over 230,000 contracts. Compare this to their current position of long more than 153,000 contracts and their most recent notable short position of more than 2,000 contracts and you can easily see that the commercial trader group has far more selling capacity behind them at this stage than buying capacity. Therefore, it is no surprise that they’re offloading their long hedges on any attempted rally. Finally, the March contract that we’re looking at has a seasonal bias that weakens into expiration. Speculative traders will want to be out of the March contract by February 24. This coincides well with the timeline for our expectations of new lows prior to this contract’s expiration.
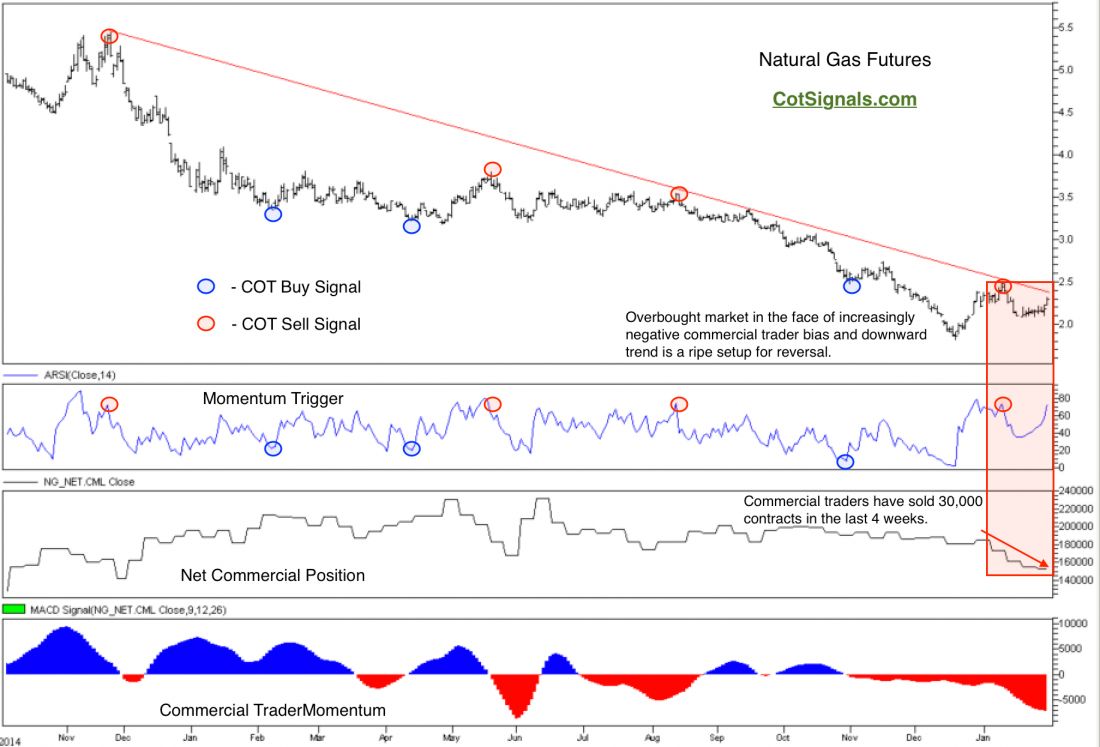
The setup for our trade is based on our tried and true methodology. We trade with the commercial traders’ momentum and we expect an overextended market to reverse course due to increasingly negative commercial pressure based on the collective analysis of the various companies’ best models. Their analysis, based on fundamental, technical, statistical and other measures is generally expected to prove correct over the mid-term. Commercial traders attempt to sell rallies above their calculation of fair value and buy the market below this number as they fulfill their consumption or, production needs for the coming period. Clearly, commercial producers don’t expect the recent rally to hold. This is very similar to their actions in November of 2014, August of 2015 and early January this year, which we pointed to right here at TraderPlanet in, “How to Profit in Thin Holiday Markets.” Commercial selling has continued to defend the multi-year downward trend and we expect this to continue through the end of February.
We’ll wait for the market to turn lower to some degree prior to entering on the short side. Once we feel the market has turned, we’ll issue the actual COT Sell Signal along with a protective buy stop price point. We always trade with resting protective stops. In the meantime, look for this market to fail as its rally tests the current downward sloping trend line coming around $2.4.
You can receive a free 30-day trial at CotSignals.com.