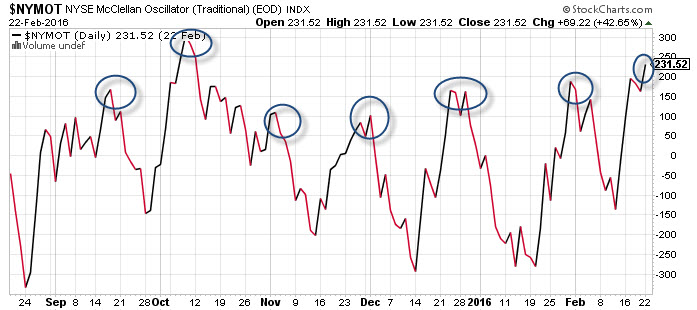
One of the best measures of market health is breadth, the advance/decline line. A tool I like to use that sizes up breadth is the McClellan Oscillator. I have written extensively on this tool in the past and reference it each day in my chat room and on social media. It is an important element in determining future direction.
We can point out areas where it appears the markets will reverse up or down. These extreme areas are evident on the chart (circles). It is rare to see extreme high levels (above 150) or extreme low levels (at -200 or lower) exist for too long. In fact, as we can see these are excellent points to put on a contrarian trade.
Even if it takes a few days, we can see these levels act like a coiled spring pulled back far and ready to snap. That happens regularly, and in a bear market such as this one the moves are severe and we have large opening gaps.
This recent move to the low 200’s was exhaustive, and hence we saw sellers take control Tuesday. The oscillator reading showed the highest odds/probabilities favored a change in trend, after a sharp move higher off the lows a pullback was imminent.