The S&P 500 cash index (SPX), the measure of large-cap health in the US market, closed at 2072.78 last Friday, down 25.18 points for a net weekly loss of 1.2%.
Having rallied 230 points since the second week of February with scarcely a pause for breath, for the past two weeks the index has been stalled by a resistance area around 2075, the upper boundary of a medium-term downtrend channel.
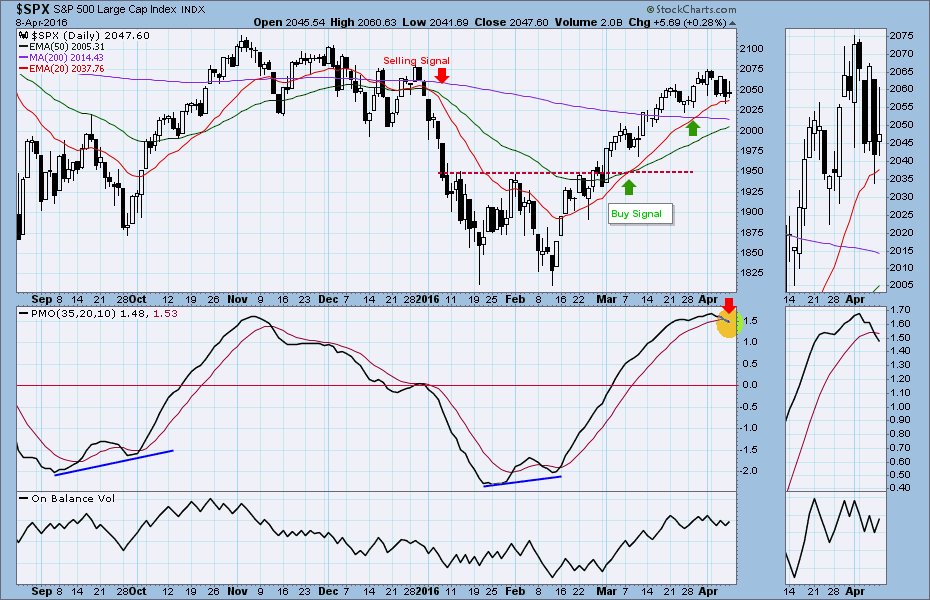
The market is consolidating around the yearly pivot in the 2050 region and trying to smooth out a temporary over-bought condition. However the long-term and intermediate-term charts are still bullish. The February buying signal remains intact.
This was only the second negative week since the rally started. There’s reason to be nervous – especially with the amount of activity we can expect this week – but nothing really bad has happened. Yet.
This week
Alcoa starts the earning season this week, and the major index options expire Friday morning. That is normally a positive for the market but this week looks a little crazy.
The Fed, which pretty much controls the short-term zigs and zags, is supposed to hold an unscheduled meeting today to discuss economic indicators and interest rates. That alone is enough to make traders tremble, but later we have seven Fed members – but not the Chair — speaking during the week.
At a time when the market is trying to decide to what to do next, any stray comment that can be attached to the Federal Reserve is likely to send the market careening up. Or down.
You can flip a coin on the direction, but our guess is that the low made today, or last week’s low (2033) whichever is lower, will be the low for this week. The signal we will be watching for is a breakout from the 3035-2050 range, and we’ll be trading in whichever direction the breakout takes.
Over a slightly longer time frame, if the index loses the 2000 support by closing below it on a weekly basis, the price is likely to go down further toward the support around 1950.
Conversely, if it holds above the 2025 level there is a chance for the index to move up around 2100 again.
For this week, as long as the Index holds above 2035 the odds will favor an upside move to retest 2075-2085 for the option expiration.
But if there is a break below 2025, the price is likely to move down further to 2005-1985 zone to test both the 200- and 40-day moving average lines. We may see new buyers at those two areas.
Today
The S&P500 mini futures (ES) is vehicle for our short-term trading. The ES traded between the 10- and 20-day moving average lines last Friday, which is mainly a consolidation behavior.
Last week’s low around 2026 will be key for the ES. A move below it is likely to lead the ES down to the 200-day moving average line around the 2005-2000 zone. The buyers may show up there.
Holding above 2034 during overnight trading could push ES back up to retest last Friday’s high at 2054.25-57.50 or higher up 2070-75, where we are likely to see the sellers step in. Nevertheless “buying on pullbacks” will continue to be active this week.
Major support levels: 2023-20, 2011.50-09, 2003-1998.50, 1980-75
Major resistance levels: 2056-58.50, 2068.50-72.75, 2084-85.50, 2103-2098.50
Visit www.naturus.com to see Nat’s full outlook for the week ahead, free of charge.
Chart: SPX Daily chart to April 8, 2016