
Although many traders use indicators like moving averages, MACD, and the like, understanding how to read price action can add exceptional value to the trader. With some study and practice, price action can help the trader determine the likely next move of the market. Let’s look at the recent price action in the S&P e-mini futures (ES) that led to a swift and large decline. We’ll see not only where the trade took place, but also how to anticipate the trade setting up well in advance of the actual entry.
The S&P e-mini futures is one of the most popular and most liquid markets traded, and it trades nearly 24 hours a day during the trading week. Although the volume remains markedly lower during the Asian and European trading sessions, the activity during these periods often sets the stage for excellent trading during the US session, when volume and activity rise.
Overnight Trading Sets the Stage
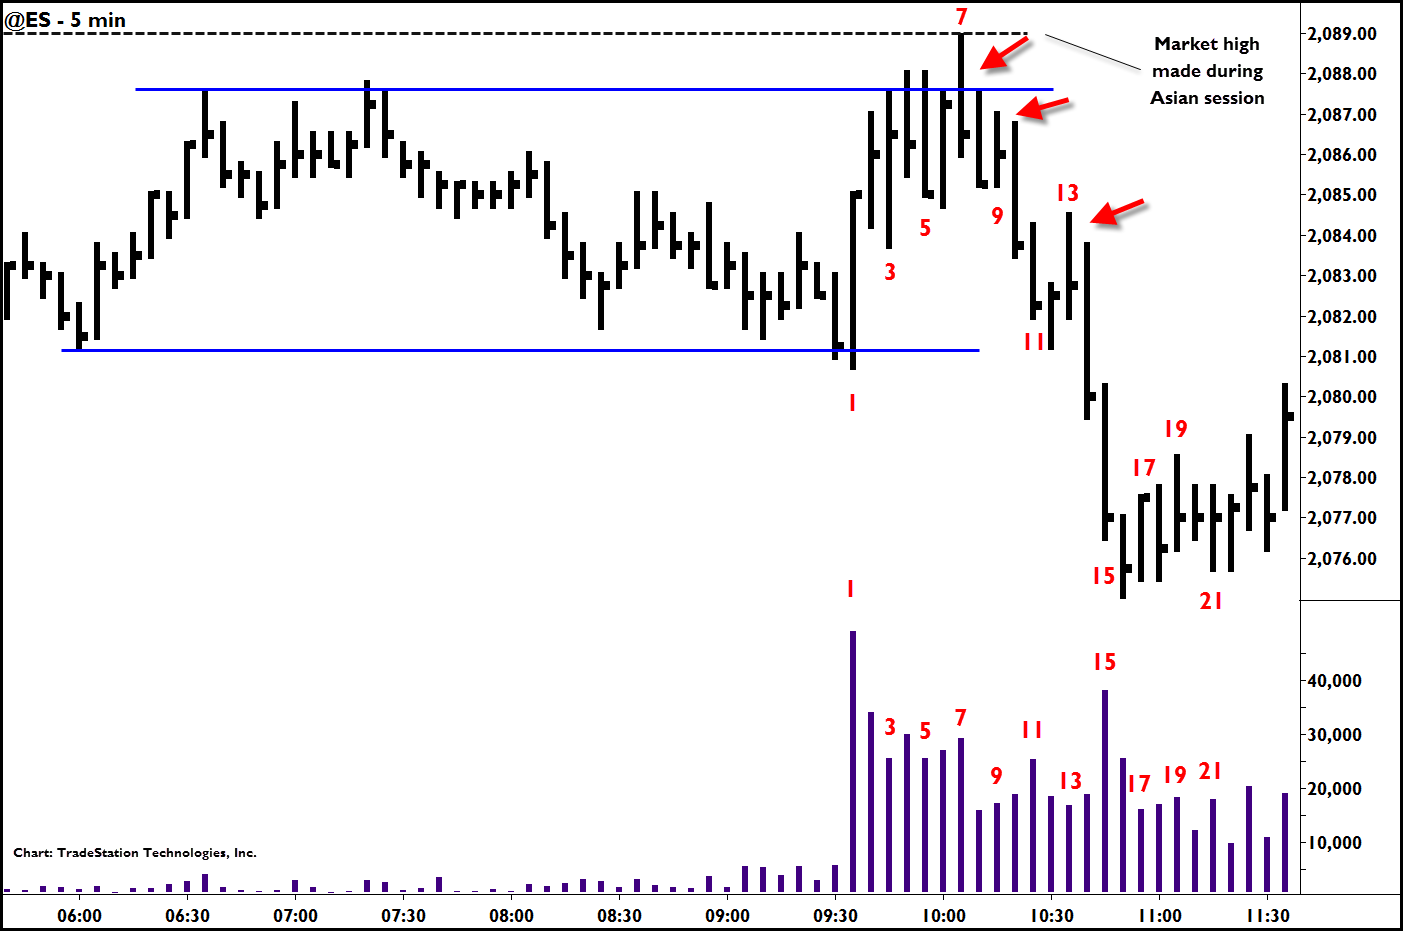
In this 5-minute chart of recent market action, the S&Ps had gone into a trading range in the two and one-half hours before the US session opened. This is marked by solid red lines on the chart. During the Asian session, the market also put in a high which is depicted by the dashed black line. Simple trend lines like these call our attention to locations of known supply and demand. When the market revisits these areas, we can evaluate how the market is likely to act once these areas are reached.
How We See Supply Take Over the Market
Beginning at the 9:35 bar marked 1, we see the market move up strongly at the beginning of the US session. Volume swells and the range of the price bar expands. This is obvious buying entering the market. In Bar 2, we begin to approach the overhead resistance at the top of the recent trading range. We see that the range is not as large as in Bar 1 and the close is off the high. Volume has also dropped off. Although this is normal behavior when approaching the top of a resistance level, coming right after the strong up move of Bar 1 makes us suspicious of the buying on Bar 1.
Bar 3 has a higher high and higher close compared to Bar 2, but a lower low. Selling forced the market lower on this bar, though buyers did push prices a little higher. On Bar 4 buyers pushed price above the trading range resistance, but could not hold it there. Instead, we see the bar close in its lower half, and, significantly, close below the high and close of the previous bar. This is the first time we see this kind of behavior. Also, it is occurring on an increase in volume. It indicates sellers are selling into the up move at the top of the trading range.
The Bars Show Weakness, Not Strength
Bar 5 shows more supply as the bar closes on its low and underneath the low of the previous bar and the closes of the prior three bars (Bars 2-4). This is weakness. Bullish markets do not act like this. The next bar, bar 6, seems reverses and closes higher. Are the buyers suddenly coming back into the market and about to drive prices higher? Not likely as Bar 6 closes underneath the trading range top and under the highs of the last three bars and did not draw out an increase in volume which is needed to overcome the obvious supply building in this area.
The UpThrust and Short Trades
A short trade initiates on the close of Bar 7. Known as an UpThrust, the market pushed above the trading range into the high put in during the Asian session, only to plunge back down under resistance. Now volume picks up a little, indicating sellers are exerting control. On Bar 9, we see a feeble attempt to rally. Note the low volume and narrow range of the bar. This is “no demand” and signifies the market is unable to rally after trading for 40 minutes in this area. It is another excellent location for a short trade.
The market then falls. As it approaches the bottom of the trading range, volume increases and the price bar ranges are wide and the closes are on the lows—all indicating strong supply. As the market tries to rally on Bar 13, but is seen to be very weak by the lack of volume and the very poor close, another short trade opportunity presents itself. The market then falls precipitously.
How We See the Down Move is Over
Large range and heavy volume occur on Bar 15 followed by a narrow range bar and then an up bar (bar 17). This indicates the downdraft has ended and because move was a sharp one, a likely rally or prolonged sideways trading range is next. Bars 21 and 22 confirm the down move is over and time to cover shorts, if not done earlier.
Reading the market by its own actions through price bars and volume is an excellent skill for the trader to acquire. Like any skill, it naturally takes study and practice. You can learn more about how to do this at the author’s website where many aspects of reading price and volume are discussed. Just click here.

