Puerto Rico defaulted on its debt yesterday, the first of what will be a series of defaults for the US territory. The effect on US equities – so far – has been invisible to the naked eye.
Puerto Rico is America’s Greece: burdened by a debt it has no hope of repaying, and unable to get a deal with its creditors because there is no legal structure available to declare bankruptcy, Congress is trying to cobble something together now, but nobody can agree and it will be too little too late in any case.
So a bond payment for $422 million that came due Sunday will be missed; and in all likelihood a second payment for more than $2 billion, due on the first of July, will also be skipped.
A good part of this is full faith and credit sovereign debt, which is supposed to be absolutely ironclad; it is currently trading at 80% below par.
This is serious stuff, and it will have a significant impact on the US municipal bond market, which is the source of capital for most of the infrastructure in America.
But the impact on the US stock market, so far at least, is close to zero.
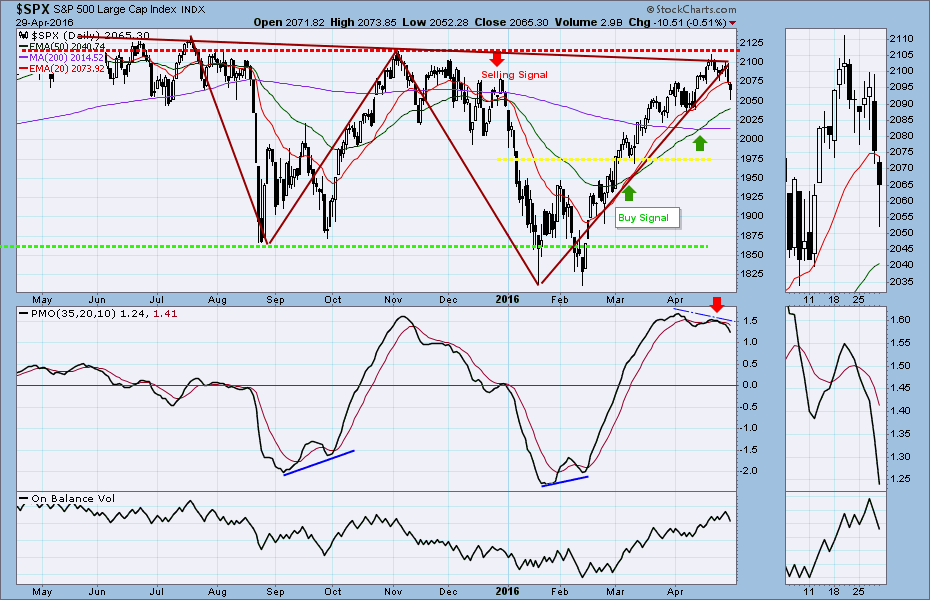
The US large-cap index, the S&P500 (SPX) closed at 2065.30 on Friday, down 26.28 points for a net weekly loss of 1.2%. But that modest decline, part of a continuing pullback in US markets, had nothing to do with Puerto Rico
The large-caps failed to regain a key resistance level (2100) last week and fell back a little, part of a continuing short-term retracement. It ended the month of April just about where it began.
So far as technical indicators are concerned, while buyers are rightly cautious about the long side, the SPX has not signaled any change in direction for the long or intermediate-term. As long as the price stays above 2015, the long-term trend is up.
This week
However the short-term sentiment has changed, and an overbought condition now encourages traders to take profits while they can. At the same time external uncertainties – like default in Puerto Rico – are starting to make the players pause before they undertake new commitments.
The favorable season for stocks classically ends in April, and the old “Sell in May and go away” sentiment starts to take over. The intermediate-term indicator (SST) also shows an overbought condition and the current short-term correction has not been completed. Bearish.
There are the Jobless Claims on Thursday but relatively little jawboning from the Fed, and there is nothing obvious to roil the markets this week. There will always be surprises, but nothing we can see at this moment points to big price swings.
The current decline could stop at the 2048 or 2020 area – or much lower if there is important news that triggers a sell-off. To prevent a larger decline the index needs to stay above the 2000-1990 zone. Otherwise a major correction could lead the price back down to the bottom area of the rectangle pattern (see chart). he minimum expected target for the short-term correction is in the 2048.50 area; the maximum expected target should be around 2015.
2082-2075 will be the key zone for this week. Failing to move above it will continue to encourage sellers and push the price down further. At this point the short-term outlook is bearish.
Today
We use the S&P500 mini futures (ES) for short-term trading.
The ES sold off Friday after the Bank of Japan changed its mind about providing more easy money. But bounced into the close. It lost 13.50 points on Friday and made a lower close.
Today ES could retest Friday’s low in the early sessions. 2045-35 will be first level to watch. As long as ES can hold this zone up, there is a chance the price will move back up to test Friday’s high area.
If ES bounces first during overnight trading (it has not so far) but remains under the 2075 level, there is a great chance for the price to drop again in the following sessions.
The short-term is bearish. ES lost two daily momentum support levels (2077 and 2068) during Friday’s trading. Those two broken support lines will be today’s resistance lines. Any time the price approaches them, sellers are likely to show up.
2035 is the current support line. A break below it will be more bearish. Odds could push the price further down toward the next major support in the 2000-05 area in the coming days.
Major support levels: 2023-20, 2011.50-09, 2003-1998.50, 1980-75
Major resistance levels: 2085-90, 2103-2098.50, 2112-17, 2125-28.50
For more free market analysis from Naturus.com, follow this link: www.naturus.com
Chart: S&P500 cash index, April 29, 2016. Daily Chart.