The stock market had a lackluster finish to the week last week. So is the pullback over? Or is it just beginning? Here’s the important price levels that will give you that answer.
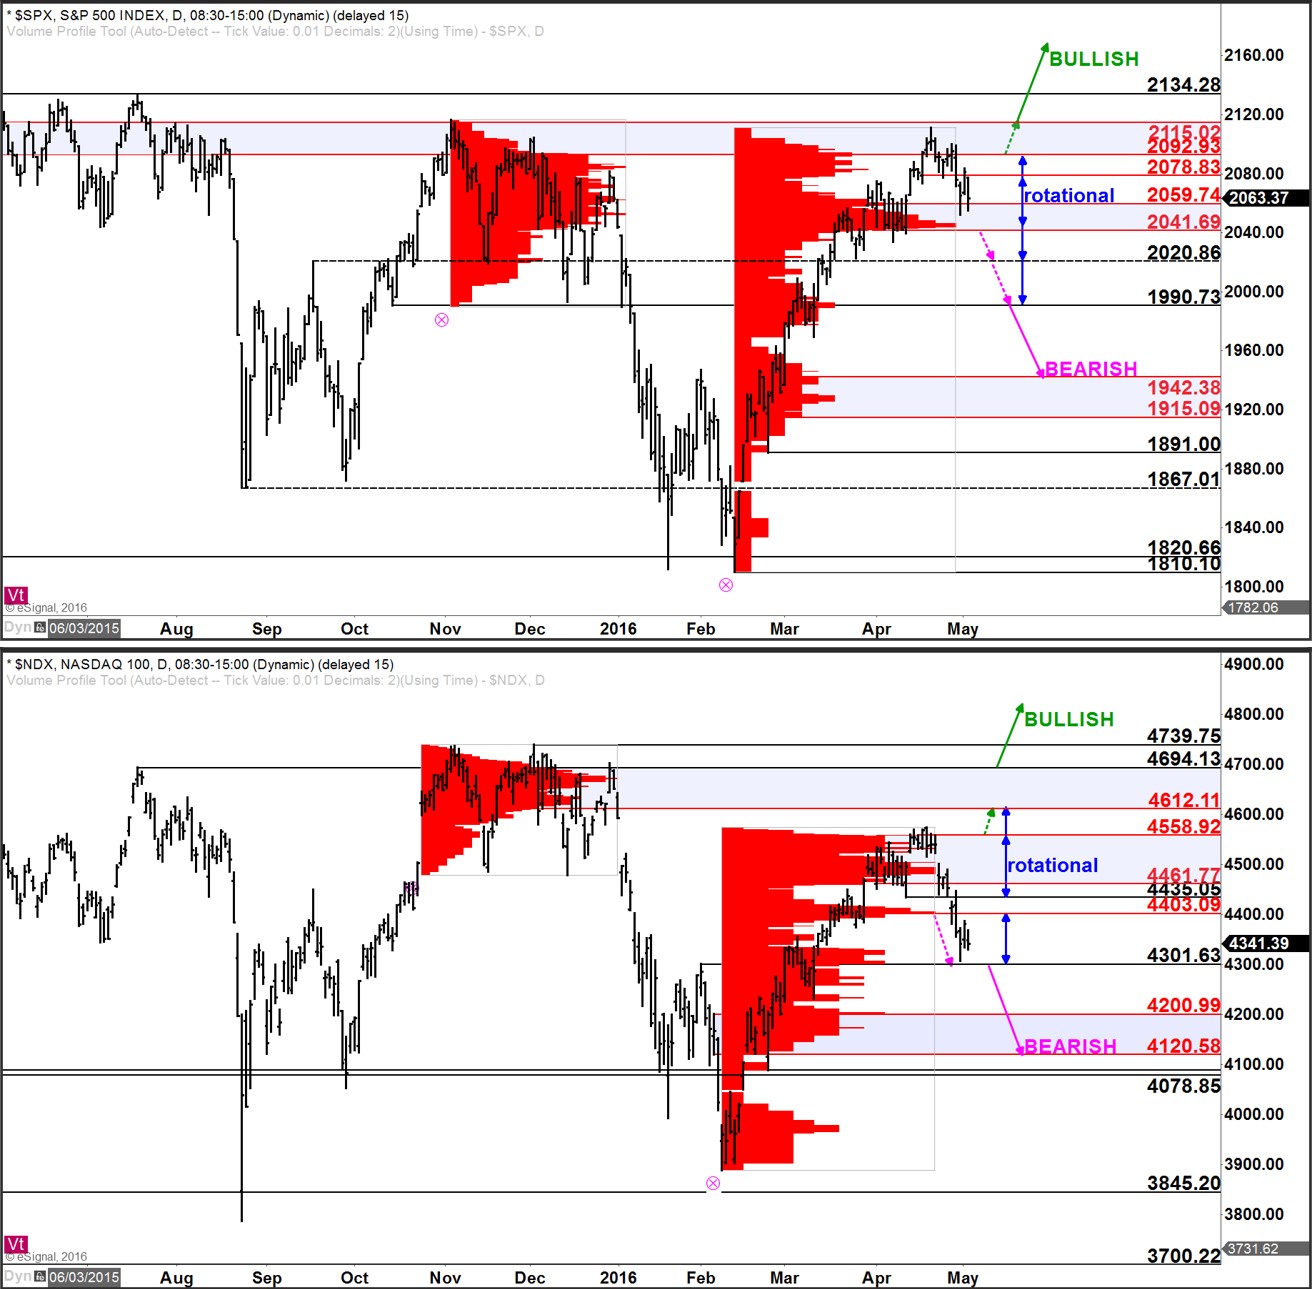
The S&P 500 index is again testing into the zone of support at 2041 – 2059. Any breach of 2041 would be a signal of a larger bearish shift taking place. On any rally attempt, there remains resistance at 2078 and 2092 – 2115. A move above 2092 or below 2041 would signal a shift to favor either the bulls or bears. While between these two extremes, the bias remains for rotational, two-sided price action.
Click here to watch a video explaining how to read markets using volume at price.
The Nasdaq-100 is so far maintaining above its low from last week that came in right at the support / target at 4301. The bias will remain rotationally biased so long as the index is able to hold above 4301. A move below 4301 would solidify that a bigger picture bearish shift has taken place. Resistance to the upside is at 4435 – 4461. A move over this zone is necessary to signal that the bulls have returned to take the upper hand.