

Along with the German DAX and the London FTSE, for which we posted charts in January and March, we also like to monitor the EuroSTOXX 50 Index for a view on the health of European equity. The Euro STOXX 50 Index is composed of 50 of the most liquid stocks throughout the Eurozone and comprises a majority of the market capitalization in the Eurozone, making it a good barometer for the zone as a whole.
Like the DAX and the FTSE, EuroSTOXX has been putting in a series of lower highs, and the Elliott wave pattern looks quite bearish. If we treat the decline from early 2015 as a year-long leading diagonal, then the three-wave bounce in recent months might represent a completed correction. The implication is that the entire developing structure will consist of five waves down, with the leading diagonal being the first of those, and the correction being the second one.
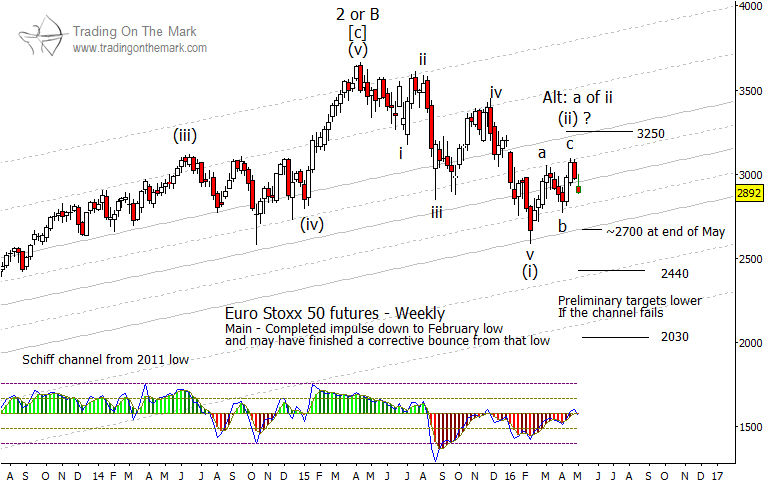
Although the corrective wave (ii) has not yet reached our main resistance target of 3,250, the strong decline during the past week is a warning sign (not a guarantee) that the correction might be finished. The next confirming signal that we might expect from chart geometry would be a weekly close beneath the lower channel line that provided support for wave ‘v’ of (i). That level will be near 2,700 at the end of May.
A decisive break out of the channel should result in an attempt to test one or both of the lower targets near 3,250 and 2,030 for wave (iii) of a possible larger five-wave decline.
Keep up with posts and articles from Trading On The Mark by following us on Twitter and facebook!

