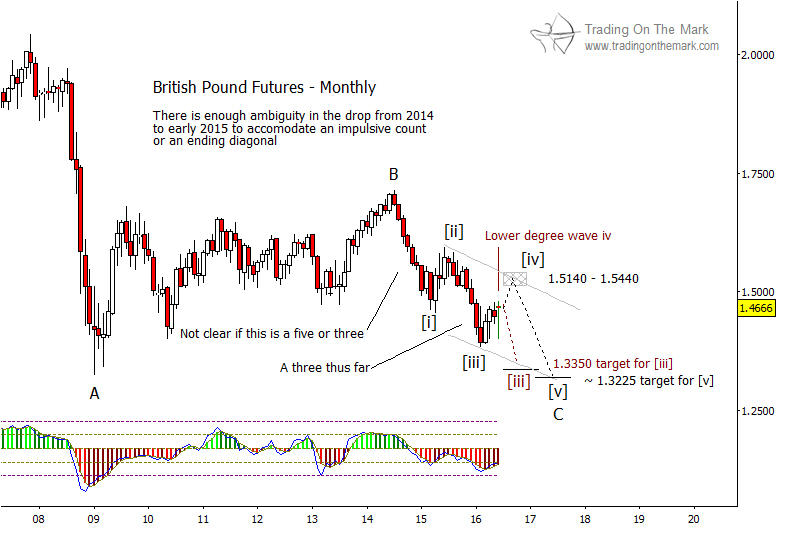
Our chart of British Pound futures shows why we don’t expect the Brexit vote to produce a drastic change in the value of the currency regardless of the decision. Although the Pound could break in either direction from its present area, the Elliott wave patterns for both scenarios suggest the next move will not be large. Even so, traders might find areas to watch for a turn near the levels we show here.
If the price action since the 2007-08 financial crisis has traced a large corrective pattern, as we believe, then the Pound is on the verge of revisiting areas near its 2008 low. We expect it to venture a bit lower during the next two or three years, but there are at least two paths by which it might go there. Both of them are variations of the way downward wave ‘C’ of the correction might play out.
In the first scenario, we might see price tracing a diagonal pattern down from its 2014 high, labeled ‘B’. In this case, price currently should be working on small upward wave [iv] of the five-wave diagonal. The main resistance area for that move lies between 1.5140 and 1.5440, after which we should see downward wave [v] of the diagonal. This scenario is shown with the black lettering and path on the chart.
An alternate view would have price tracing an impulsive five-wave move down. In this case, price should find resistance near its present area and should move downward to finish wave [iii] beneath its February 2016 low. This scenario is shown with the red lettering and path. Eventually, this scenario would take price even lower than the area we have marked as red [iii], but only after some consolidation.
Follow us on Twitter or facebook to get timely market alerts!