S&P 500: The latest Jobs report is like a bikini; it arouses interest, but conceals the most important stuff
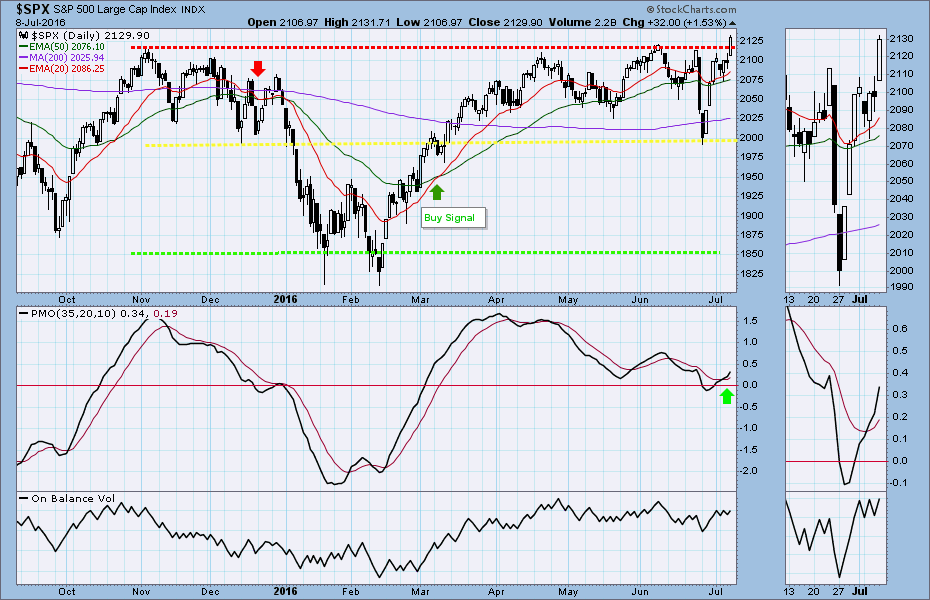
The S&P 500 cash index ($SPX) closed at 2129.90 last Friday, up 26.95 points for 1% week gain, based mainly on an anomalous employment report from the Bureau of Labor Statistics.
As with all BLS employment reports, this one is like a bikini: what it shows is interesting. But what it conceals is crucial.
The interesting part is a massive, totally unexpected increase in employment: according to the BLS, the America economy added 287.000 jobs in June, the best results since last October and much higher than the 180,000 new jobs which was the consensus forecast.
The crucial part is that a) these numbers, like all BLS reports need to be treated with great skepticism, because they will later be subject to substantial revision; and b) while they serve to goose the market immediately, they don’t reveal much about the real economy. In fact in this case they conceal a more important underlying trend.
The Jobs report for May showed a disastrous 67,000 new jobs created (subsequently revised down by 11,000); the report for June shows a totally unexpected 287,000 new jobs.
The plain fact is that both are statistical outliers; and when they are averaged out, you get about 150,000 new jobs a month (assuming the figures are accurate) which is far less than the roughly 200,000 new jobs America needs each month to accommodate natural growth. It also reveals a continuing decline in employment over the past six months.
There are other problems with the employment numbers as well; some 90% of the new jobs went to workers 55 or older – get back to work, gramps! – and the real rate of unemployment, when you count the people who want full time jobs and can’t get them, is north of 10%, not the 4.9% you are reading in the headlines
But none of that matters to the market, which rallied 40 points on Friday, recouping all of the pre-Brexit losses, and touching (briefly) a high last seen a year ago, and just a couple of ticks below the all-time high. The advance/decline line was especially strong, indicating a broad-based rally.
We are technical traders, and revisiting a long-time high (and resistance level) is a significant event. But this market just doesn’t feel right. We have hit this resistance level before and been rebuffed, and both bonds and stocks are making highs simultaneously, which just shouldn’t happen.
We’re watching for a move higher; but with one eye on the exit.
This week
The chatter this week will revolve around the Fed, as it so often does these days. There are no fewer than 13 public appearances by members of the Federal Reserve scheduled in the next five days, and the recent bump in the Jobs number has the commentariat wondering out loud if there is room for the Fed to raise rates.
Fugedaboutit. The presidential election is in four months, and anyone who thinks the Fed will do anything that might knock the market down before then should be compelled to share their drugs with the rest of us. Watch what they do, not what they say.
There’s a reason the market is almost always up in the fourth year of the presidential cycle, and this is it.
One event this week that might hold the market back is the start of the Q2 earning season. Earnings are not expected to be very good – they have been steadily declining for the past three quarters – but there will be the usual bullroar about beating “expectations.”
The more significant fact is that there is a blackout on corporate stock buybacks during the reporting period, and that will restrict a major source of strength in the market.
Numbers to watch in the SPX this week:
2070-80 becomes the current major support zone. It is likely to see new buyers step into the long side if there is an ultra-short-term pullback to this area.
2135.50-37.50 will be a key zone for this week. A break above it could lead the index higher up to 2150-85 or higher if the momentum is strong.
Today
For the S&P500 mini-futures (ESU6):
The ES had a monthly high breakout move Friday, and closed at June’s high area. The price action was strong and bullish.
Today 2126.25-34 becomes a very important zone. This was previously a major strong resistance area, which has been holding ES down for more than a year. The ES needs to break through this zone to make new highs and close above it to give final confirmation that the yearly resistance zone is broken.
A failure to break above this zone could lead ES to repeat last Friday’s range or move down further to close the 2092 gap if the price breaks below 2097.
However a pullback today will likely be regarded as an opportunity for buyers to get in on the dip.
Major support levels: 2103.50-00.75, 2093.50-92, 2085-83.50, 2075-73.50
Major resistance levels: 2033.75-35.50, 2043.75-45.50, 2056.50-57, 2065-68
Visit Naturus.com to see detailed previews for gold and the S&P500 futures for the week ahead. Free.
Chart: SPX Daily chart to July 8, 2016