Normally, we select one chart and develop a specific trading plan for a Monday morning quick hit trade here at TraderPlanet. This morning, I’d like to look at the equity index futures in aggregate and explain a simple but, effective technique for hedging or, outright shorting opportunities in the equity markets. There are many angles to the stock market, interest rates and the global economy. We’re going to skip the macro analysis and focus on the warning signs that are setting us up for a trade, rather than ephemeral macro hyperbole.
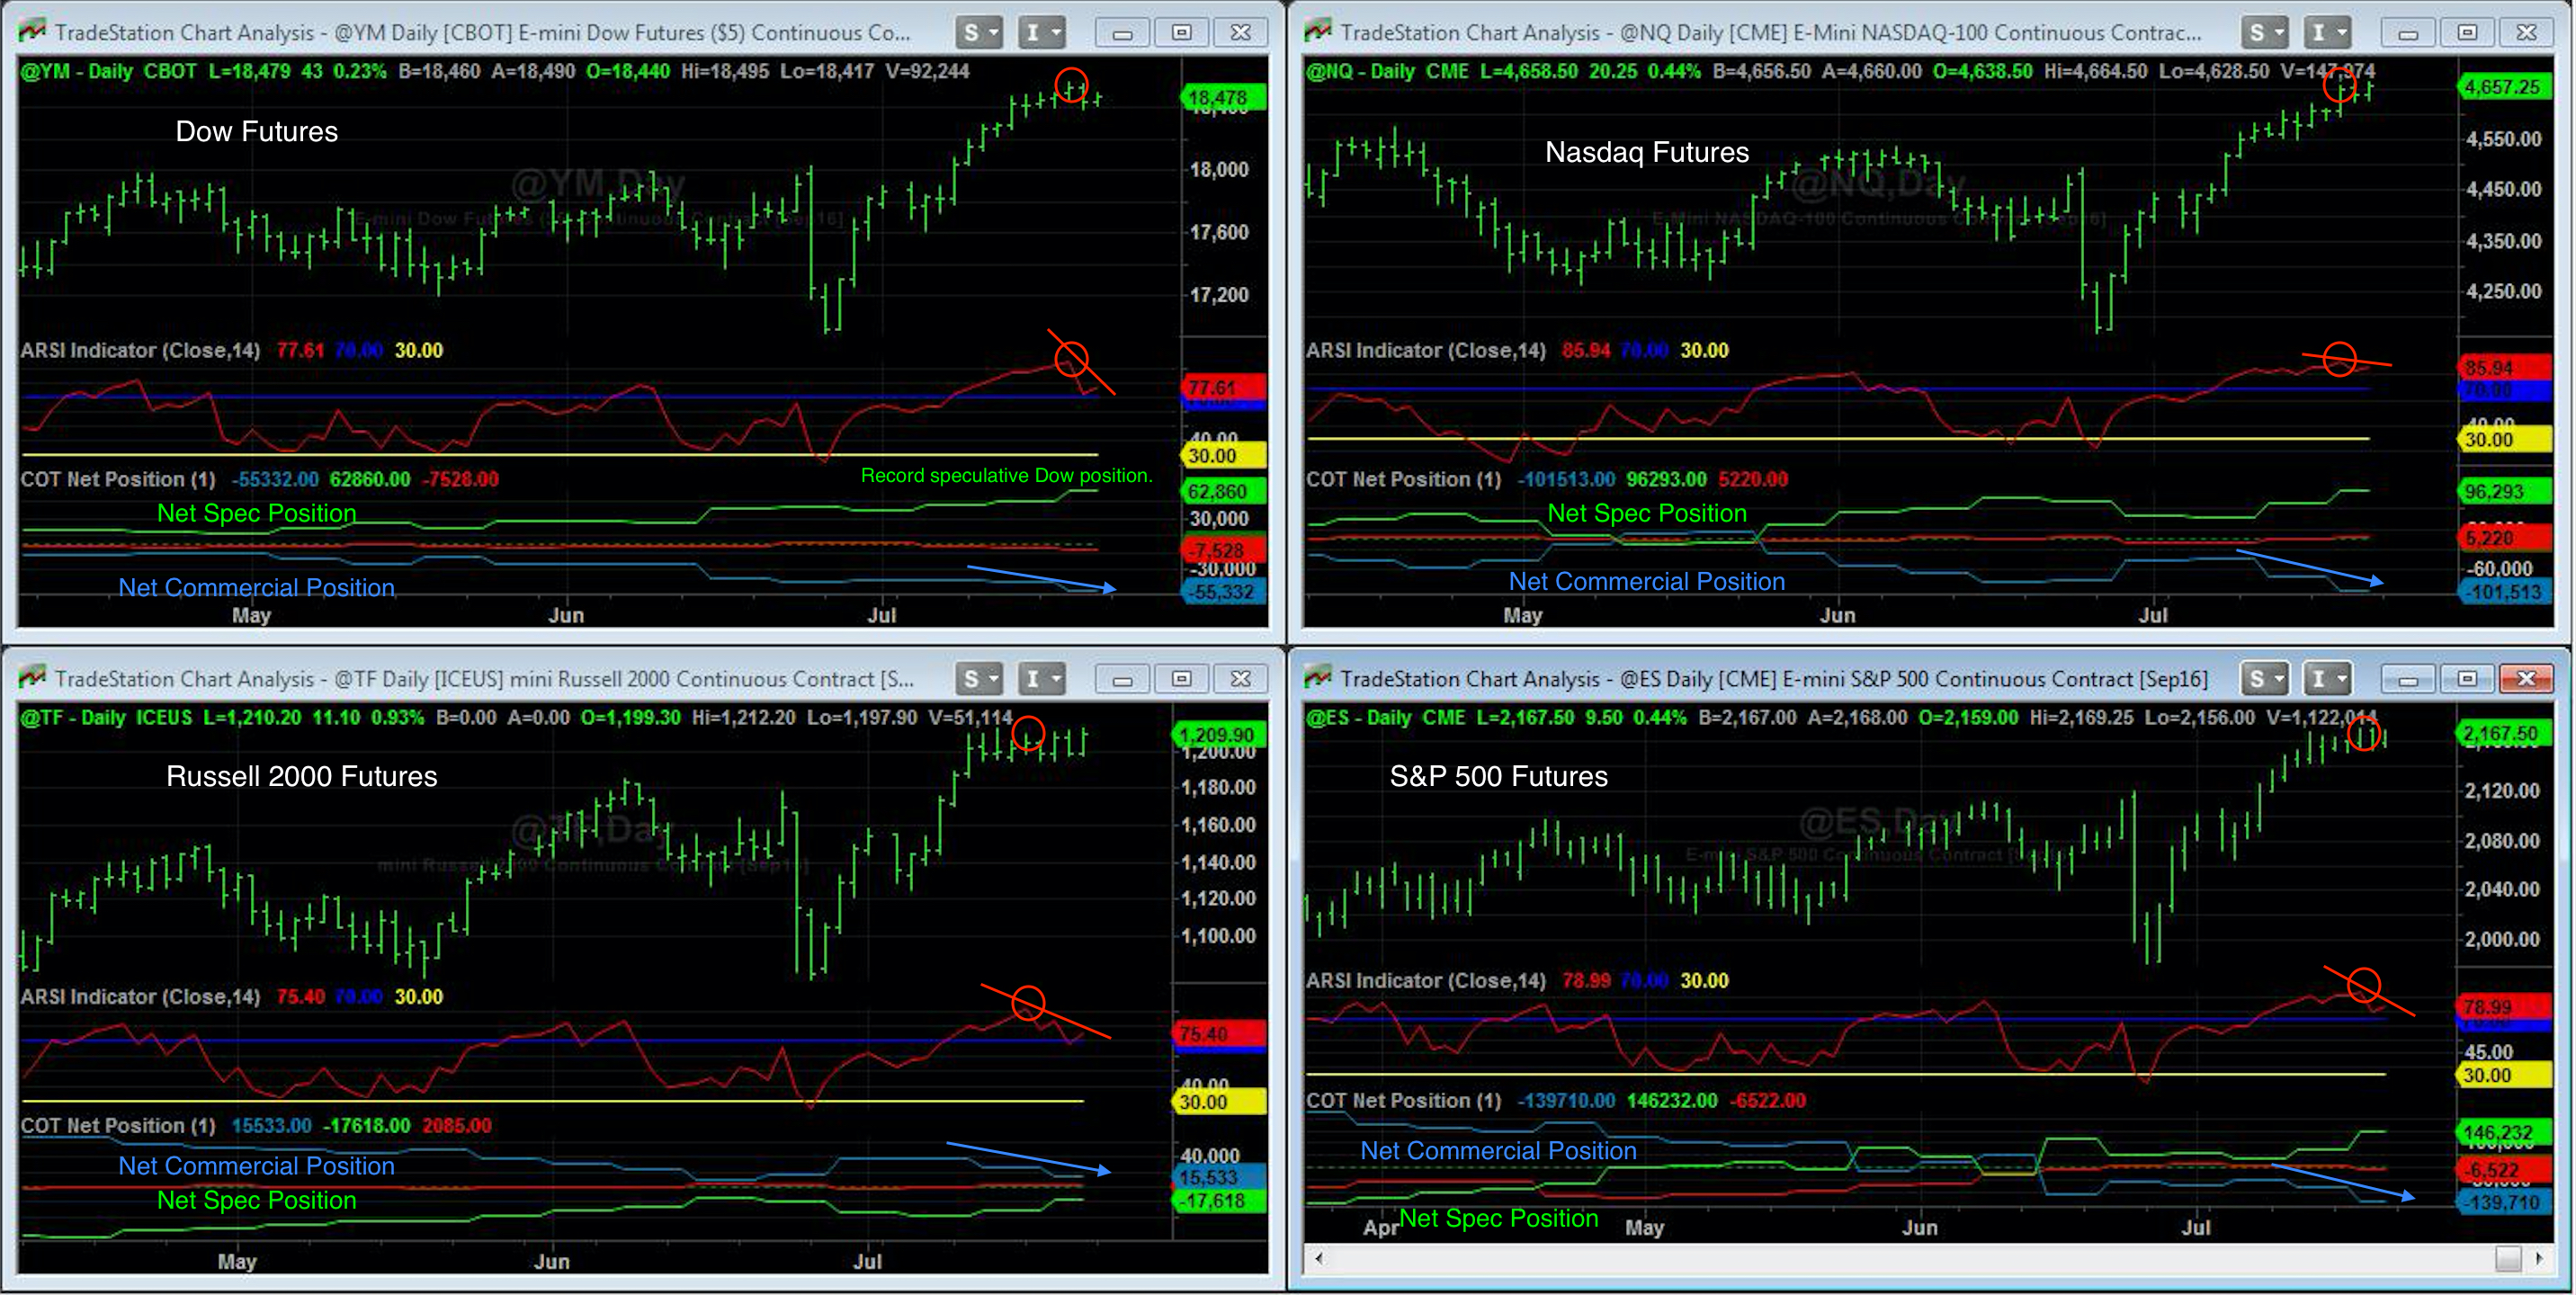
As many of you know, we focus on the CFTC’s weekly Commitments of Traders reports. We use this to track the net and total positions of the speculators and the commercial traders. Our research has shown that when their positions reach extreme imbalances, recent market direction is usually, about to reverse its course. It’s very simple if you think about general market movement and the action of its players. A speculatively driven move tends to end when it runs out of new speculators to continue forcing the action and propelling the market. Meanwhile, the commercial traders are simply locking in hedges at increasingly better prices as the speculators over extend themselves. Therefore, the record speculative net long position in the Dow futures as it makes all-time highs, fits this criteria perfectly.
This alone, is not enough to base a trade on. This merely sets the stage by telling us that this market is significantly imbalanced between the commercial traders and the speculators. We also need a trigger to tell us when we can actually expect the reversal. We use a modified RSI indicator to track the underlying market’s momentum. Usually, this means watching for overbought and oversold conditions against the speculative position, waiting for a cross and executing the trade accordingly. This time, we have a secondary, technically bearish theme developing through this indicator in the form of a classic bearish divergence. This occurs when the underlying market reaches a new high or low but, our momentum indicator fails to register the new high or low, accordingly. As you can see in the charts below where we’ve marked the recent highs, our momentum indicator has failed to register new highs on the indices’ recent strength. Please note, however that this indicator has not crossed and the short sale signal has not yet, been generated.
Based on the current action, we think the Nasdaq could make a new high as it closed last week right on its highs. Usually, the way this plays out is that we’ll get another pop towards the highs and it will not be confirmed by our momentum trigger. The market will then reverse lower and we’ll publish the sell signal in our nightly discretionary Commitments of Traders email. We’ll also publish a protective buy stop at whatever price the swing highs turn out to be. We’re swing traders therefore, we always trade with protective stops. Typically, we’ll see a sell off back down to the previous resistance levels, which will now act as support. As traders, we’ll look to take profits near these support areas of 18,000 in the Dow, 4,550 in the Nasdaq, 2,100 in the S&P and 1,175 in the Russell.
Now, for the hyperbole. This is a classic trading setup that we view as just another trade. It’s important to remain dispassionate towards market analysis. However, given the global state of flux with so many heavily weighted variables at play, we do think it’s possible to put in a summertime, pre-election high in the equity markets and this setup could prove its worth.
We offer a 30-day free trial to our discretionary COT Signals nightly email. Odds are, the actual sell signal and corresponding protective stops will be generated sometime during this period. Feel free to try us and see how this develops. It’s not rocket science. It’s hard work and consistent application that generates successful trading over the course of time.