

The stock market indices took a tumble on Friday only to gain back most of the losses on Monday. Then Tuesday’s session gave back all of Monday’s recovery. So what does this mean and what’s next in the SPX?
Click here to watch a video explaining how to read markets using volume at price.
After weeks of low volatility, sideways trading in new all-time high territory, the SPX cracked lower and put in what was a very negative down day.
What do I mean by a ‘very negative down day’?
I’m referring to the breadth readings (advancing issues minus declining issues). Breadth was extremely negative on Friday’s selloff, registering an extreme not seen since the hard break from last August 2015. (side note: here’s my article about that break down ‘They Were Warned About the Crash 43 Times
’)
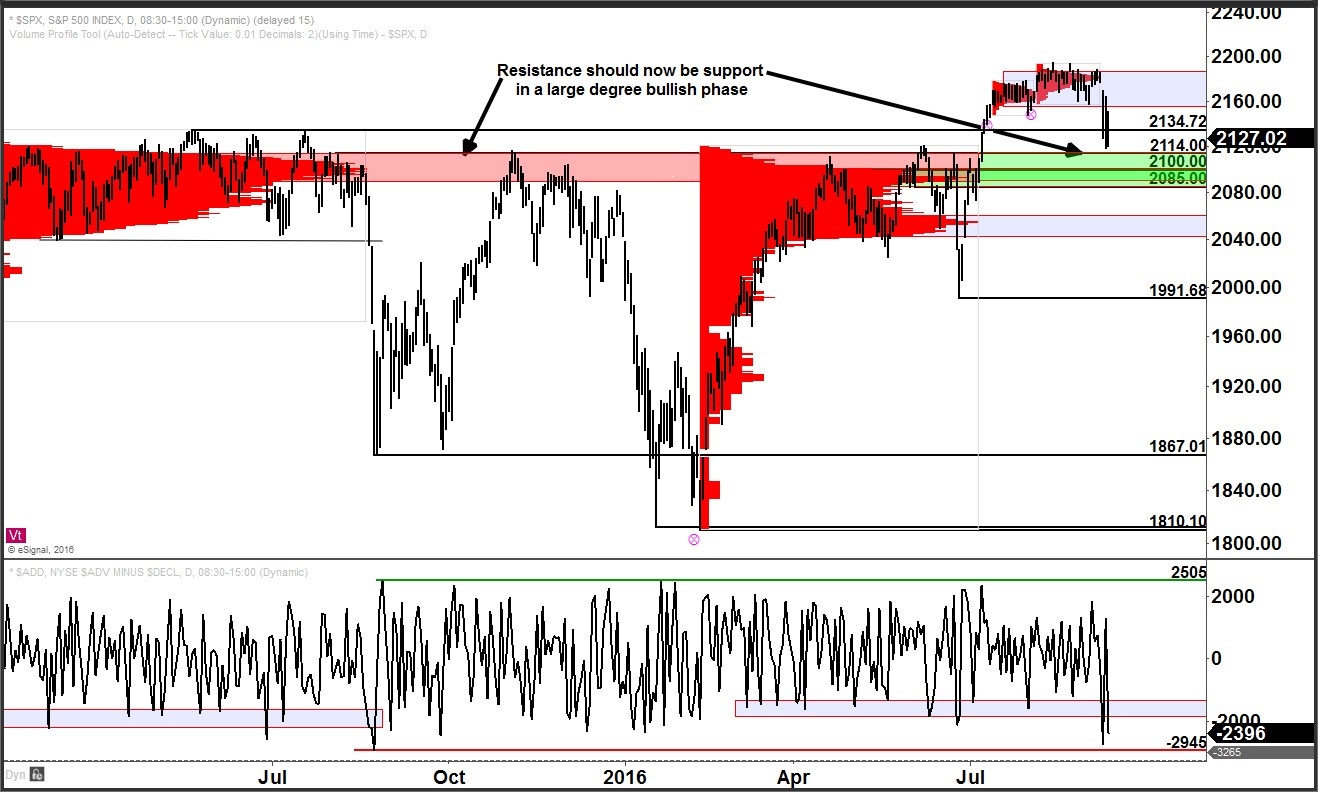
Something I mentioned in that article is once again in play. The key resistance zone I mentioned as being established was 2092 – 2115. It took the SPX a full 2 months to rally back to that area but then it held multiple times over the course of November before sending the SPX on a hard decline once again.
As you can see from my chart below, I have marked the established support zone at nearly the same spot, 2085 – 2114. And it once again is a critically important zone.
My big-picture assumption is that this market is transitioning into a new large degree bullish leg higher. This assumption is based primarily on the fact that the SPX has moved to new all-time highs and has several large degrees of trend all aligned pointing upward.
With this being the case, the zone 2100 – 2114 should see a robust and aggressive buying response. Even in a short-term, high momentum move lower, the 2085 level should not be violated and any move into the 2085 – 2114 zone should be brief and the buying response should be profound and carry the SPX higher to test and exceed initial resistance at 2159 – 2175 at least.
If we do not see the price action I describe in the preceding paragraph (read it again) upon a test to 2014/2100/2085 and especially if 2085 breached, my big-picture assumption will be negated (aka, I will have been proven wrong). If that occurs, the message would then be that the market is likely in big trouble.
Furthermore, a failure of this 2085 – 2114 support zone would be a substantially negative and bearish failed breakout at a very large degree. A failed breakout at this degree of scale would suggest that the 1810 low was likely to be exceeded to the downside. At present, this is not my expectation but it is the objective analysis of the market’s position in relation to the established key reference areas.
Why spend so much time outlining a scenario that I do not see as the favored scenario at this point?
For one, it is a scenario that carries a substantial amount of risk should it come to pass. So being aware of what and where ahead of time is only prudent. The other reason I must acknowledge the downside scenario is due to the recent extremely negative breadth readings on the initial drop.
History would suggest that an extremely negative breadth reading like what we just saw sometimes ends up being the warning shot that, for those paying attention, could have clued them in that a larger downside scenario was unfolding.
When I say ‘unfolding’, I say that because usually it’s not signaling an immediately large downside event but instead signals a short-term low that launches a recovery attempt. It’s the response following the recovery attempt where a larger degree decline that gets moving in earnest takes hold after the recovery attempt fails.
So as I talk from both sides of my mouth here, I am anticipating support and a buying response from the 2114/2100/2085 zone. If that support zone fails, now or later, my anticipations will make a rather drastic about-face.
For a Free video training on How To Read Markets Using Volume-at-Price, click here.

